Project Overview
1. This websites purpose is to help users read and understand information from a research project about the stream water quality around Asheville, North Carolina.
2. The intended users of this website will be for anyone wanting to learn more about the stream water quality in asheville.
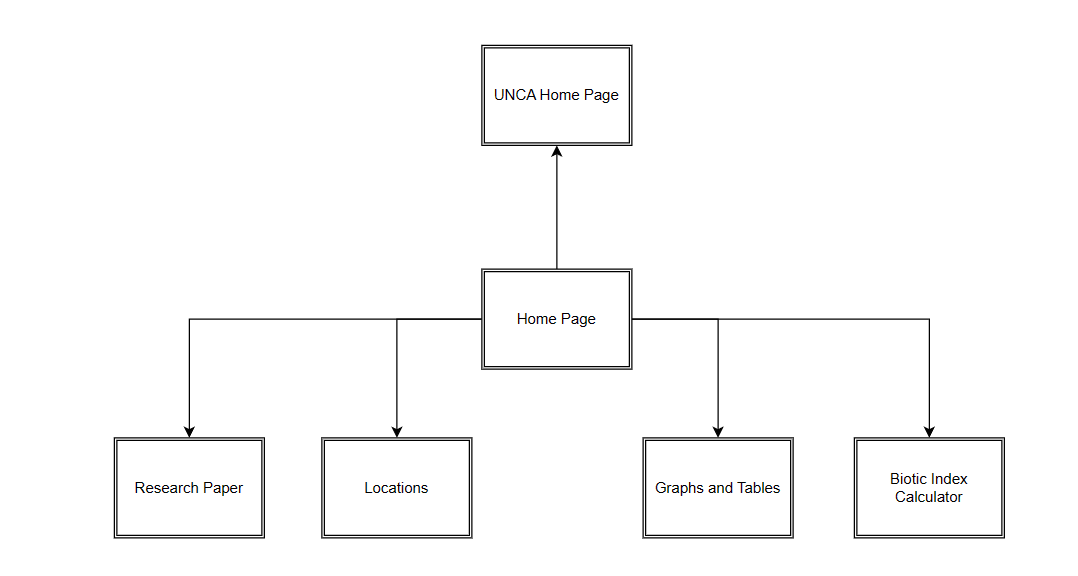
3. The website will feature an introduction page about the project, the research paper along with definitions, information about the streams the data was collected from, various tables and graphs, and lastly a calculator that will let others build a graph.
Client Information
Name: Samuel Dormady
University: University of North Carolina at Asheville
Email: sdormady@unca.edu
Phone Number: [Private]
Wireframe
Site Map
Page Design
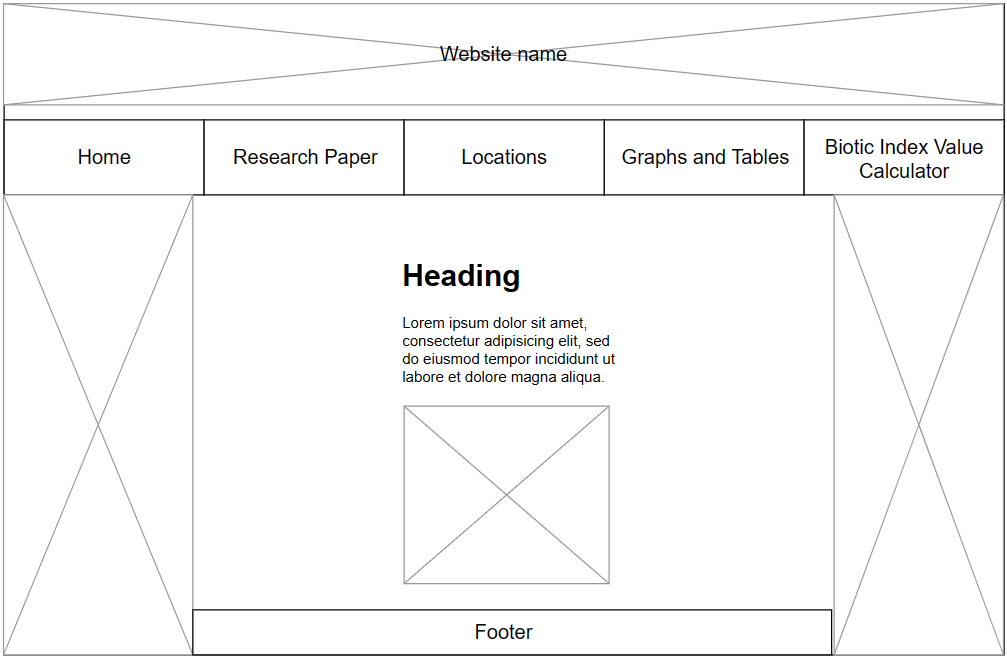
Page Name: Home
Purpose: A homepage for the site
Users: All users.
Content: This page will feature a few paragraphs and images providing a short overview of the research project.
Data Entry: N/A
Validations: N/A
Buttons/HyperLinks/Dropdowns: Link to the UNCA hompage, navigation links.
Actions: Navigation links to other pages in the website, as well as links to the UNCA page.
Notes:
Page Name: Comparison of aquatic macroinvertebrate communities between forested and urban streams (Not final).
Purpose: This page will be the location of the research paper, as well as some definitions.
Users: All users.
Content: This page will feature a short paragraph to introduce the paper. The paper will be underneath the paragraph, and users can scroll down to the definitions.
Data Entry: N/A
Validations: N/A
Buttons/HyperLinks/Dropdowns: Navigation links, scrollbar.
Actions: Paper will be in a seperate window and can scroll up and down independetly of the main page. The user can also hover over words and have a pop up with a definition.
Notes: Would like to include a feature that will alow the user to hover over a word and have the definition pop up.
Page Name: Locations Visited
Purpose: This page will have photos of the different streams data was collected from as well as a short paragraph with information about them.
Users: All users.
Content: This page will feature photos and information of all the streams that were sampled. The images will be displayed in a carousel.
Data Entry: N/A
Validations: N/A
Buttons/HyperLinks/Dropdowns: Navigation links, buttons to progress slideshow.
Actions: Navigation links to the other pages in the website. When the user clicks the button to progress the slide show it should come from the direction they clicked from.
Notes:
Page Name: Graphs and Tables
Purpose: The purpose of this page is to display the graphs and tables form the paper as well as some additional information to help present data from the research.
Users: All users.
Content: This page will feature many different tables and graphs including data from the research paper, as well as additional information.
Data Entry: N/A
Validations: N/A
Buttons: Navigation links, buttons.
Actions: Navigation links to other pages in the website. The buttons when clicked will let users hide and show graphs and tables.
Notes: I would like to see if I can make the tables and graphs interactable in someway.
Page Name: Biotic Index Value Equations
Purpose: The purpose of this page is to let users input information and data to find the biotic index value, and generate a graph or table.
Users: All users.
Content: This page will feature some forms asking the user for specific information. Using their inputs, it will then generate a graph or table.
Data Entry: Yes, will be asking for numbers.
Validations: Yes, will check to see if the user has enterd the correct data type, and will require them to fill out some areas.
Buttons: Navigaton links, buttons.
Actions: Navigation links to the other pages in the website, reset and submit button for the data fields.
Notes: I would like to make the tables and graphs interactable in someway.
Dynamic Functionality
The website will include dynamic headers and footers. The Biotic Index Value page will include math functions, and a script to build a table or graph. The Locations page will have a carousel with images that will be implemented using javascript. Lastly, the research paper I want to include in a seperate window, and if possible have deffinitions pop up when a user hovers over a certain word.
WolframAlpha alows users to input data and will generate a graph based off of the data entered.
Wikipedia has a feature that alows users to see pop ups that contian a short paragraph of text when mousing over a link.