function pass_fun                                         %J. M. Hill  2011
%Incremental Search Root Finder with Bisection Method with function passed
%through argument list
xleft = 0.;             %input start of interval
xright= 4.;             %input end of interval
a = xleft;              %save original for plot range
b = xright;             %save original for plot range
nsteps = 20;            %number of steps on the interval
epsilon = .0001;        %set convergence criterion
dx = (xright - xleft)/nsteps; %determine step size
x = xleft;              %initialize x to left side of the interval
while (x <= xright)     %use incremental search to step along x axis
  y = f(x);             %evaluate function at left end of intervel
  x = x + dx;           %increment x
  yright = f(x);        %evaluate function on right side of interval
  if(y * yright <= 0)   %a root is trapped in the interval
      root = findroot(x,dx,y,epsilon);  %invoke the bisection method
      fprintf('root = %6.4f   y = %6.4g\n',root,f(root));
  end
end
fn = @f;                %get function handle
plotxy(a,b,fn);         %pass interval limits and function handle to plotxy
end
%--------------------------------------------------------------------------
function root = findroot(xright,dx,yleft,epsilon)
%locate the root in the sub-interval using the bisection technique
xleft = xright - dx;    %back up to left side of interval
while(abs(yleft) >= epsilon)
    xmid = (xleft + xright)/2.;
    ymid = f(xmid);
    if(ymid*yleft < 0.) %root is in the left half of the interval
        xright = xmid;
    else                %root is in the right half of the interval
        xleft = xmid;
        yleft = ymid;
    end
end
root = xleft;
end
%--------------------------------------------------------------------------
function fx = f(x)
     fx = x*sin(x^2);
end
%--------------------------------------------------------------------------
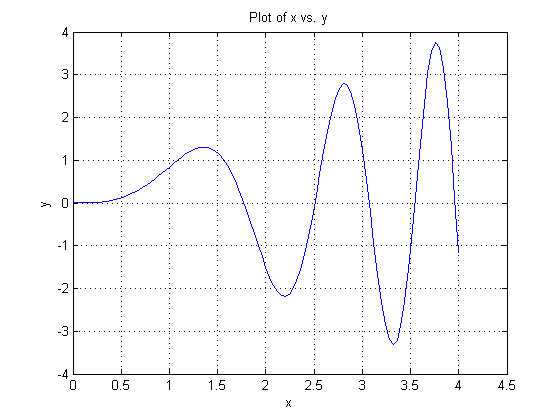
function plotxy(a,b,fn)
dx = (b - a)/100;
xx = a;
for i = 1:101
    x(i) = xx;
    y(i) = fn(xx);
    xx = xx + dx;
end
plot(x,y)
title('Plot of x vs. y')
xlabel('x')
ylabel('y')
grid
end
root = 0.0000   y =      0
root = 1.7724   y = 3.217e-005
root = 2.5066   y = -7.49e-005
root = 3.0700   y = 6.253e-005
root = 3.5449   y = -2.728e-005
root = 3.9633   y = 8.521e-006
