GeoDesign
Tutorial 14 - ArcGIS Online (arcgis.com)
Objectives:
Introduction: What is ArcGIS Online?
ArcGIS Online is a cloud-based, collaborative content management system for working with geographic information and allowing users to produce, edit, and share geospatial data.
Designed by Esri, the makers of the popular ArcGIS software suite, ArcGIS Online is meant to act as a Web-based mapping solution for everyone from GIS professionals to those with no formal GIS training.
Access ArcGIS Online through a website (arcgis.com), mobile devices, and desktop map viewers to:
- Create web maps
- Web-enable your data
- Share your maps, data, applications
- Find relevant and useful basemaps, data, configurable GIS resources
- Manage content and people in your organization
For more background on ArcGIS Online, please visit
help.arcgis.com/en/arcgisonline/help/index.html#/What_is_ArcGIS_Online/010q00000074000000/
Known limitations of ArcGIS Online include:
- Users are limited to 2 GB of storage using their Esri account
- Only 1,000 points are allowed in each file upload
- Problems saving and viewing may occur if more than 10,000 points are inserted into a map
Getting Started: Introduction to the Interface
ArcGIS Online requires an Esri global account to upload data and save maps. If you do not already have an account, you can create one by clicking the Sign-up now button in the bottom left corner of www.arcgis.com. If you already have an account, or after you have created an account, you can log in by clicking Sign In on the main screen of www.arcgis.com.

Once logged in, you will be redirected to the My Content section. This is where you can see and organize all of your existing maps, as well as set permissions.
From this screen, click the Create Map button to enter the ArcGIS Online web application. You will be presented with a screen similar to this:
The top left corner contains three important tools: the Details sidebar, the Add menu, and the Basemap selection button.
The Details sidebar has three additional buttons at the top: About this Map, Show Contents of Map, and Show Map Legend.
Once some data has been added these buttons can be used to provide information about the resulting map:
- About this Map displays basic metadata about the map, such as who created it, the date it was created, ratings, views, and comments.
- Show Contents of Map lists the layers of the map, and allows the user to edit their attributes.
- Show Map Legend displays map symbology.
The Add menu is how map layers and other data are added to the map document. The user can choose to search for layers, create an editable layer, add a layer from a file, or add a layer from the Web.
The Basemap button allows you to choose one of twelve different basemaps. These range from satellite imagery, to street maps, to topographic maps. The best basemap is application-dependent and will depend on the dataset being visualized.
Explore a Web Map in ArcGIS Online
The ArcGIS Online website is a place to find maps, explore them, and share them with others. It's also a place to make your own maps.
As a new user of the website, the first thing you might want to do is find a map made by someone else and see what you can do with it.
Find and open a map
Open a web browser to www.arcgis.com
This is the home page of the ArcGIS Online website.
In the upper right corner of the web page, in the Find maps, applications, and more box, type crime comparison and click the Search button.
You'll see a list of web maps with crime as their subject. (You'll also see web mapping applications, too. These are maps with custom enhancements.)
Scroll down until you see the Crime Comparison with Transportation Map by ArcGISTutorials shown below
Let’s find out something about it first
Click Details and read the description. This map shows highways and rest stops against a crime map.
Below the thumbnail image of the map, click Open and choose Open in ArcGIS.com map viewer
The map opens in your browser window
Navigate the map
Zoom in a few levels with the slider bar in the upper left corner. (You can also use the mouse wheel or hold the Shift key and draw a box on the map.)
As you zoom in, you'll see more and more detail: states, counties, ZIP codes, and so on
Pan the map (move around) by dragging it
On the toolbar, click Bookmarks and choose USA 48, this allows you to fly high above and see the entire lower 48 states.
A bookmark is a saved map extent that you want to revisit
Get information
The map is symbolized in shades of orange, but we don't know yet what the colors mean.
In the side panel, click the Show Map Legend button.
Dark orange states are above the national average in crime. Light orange states are below it. Yellow states are far below it.
Click a state. A pop-up window opens with detailed information. The bar chart shows indexes for different types of crime. Hover your cursor over each bar in the chart to see index values for different types of crime.
Look at the map contents
In the side panel, click the Show Contents of Map button
The map contains four layers: Rest Areas, World Transportation, USA Crime Index 2010 and Light Gray Canvas
Uncheck the box next to Rest Areas. The Rest Areas data is turned off. Note that the basemap can't be turned off.
On the right side of the toolbar, in the Find address or place box, type Austin TX in the box and click the Search button
The map zooms to the city of Austin, Texas.
Click a location and see detailed crime information. The bar chart shows more indexes for different types of crime.
Set layer properties
In the side panel, place the mouse pointer over the USA Crime Index 2010 layer and click the small arrow that appears to the right
On the context menu, place the mouse pointer over Transparency
Move the slide back and forth
On the toolbar, click the Basemap button. Click the Streets basemap
This basemap gives you more geographic detail, like street names, at large (zoomed-in) scales.
Share the map
Explore some places of interest to you. Use the "Find address or place" box to locate your own city or your home address
You might want to share the map at this local scale with friends or neighbors
On the toolbar, click the Share button.
In the Share window, highlight the URL in the Link to this map box
Copy the link with your keyboard shortcut, then close the Share window.
Paste the link in an e-mail message and send it.
You can post the link to Facebook  or Twitter or Twitter  by clicking the or icons on the Share dialog box. by clicking the or icons on the Share dialog box.
Downloading Layer Packages from ArcGIS Online
A layer package includes the data inside the package, so it is self-contained and can be opened by any other ArcGIS user. People will be able to download your file and work with the data in ArcGIS for Desktop and ArcGIS Explorer Desktop.
There are actually a couple of ways to use layer packages; one is by connecting to the layer package from where it is stored on ArcGIS Online, the other is to download the layer package as a local copy. Here’s how both work.
Go back to ArcGIS Online homepage, click ArcGIS on the top-left corner of the window.
From ArcGIS.com you can search for any type of content. The default is to search for Web Content Only but you can toggle that to look for All Content, which will show all item types, not just things you can use directly in a browser.
Search for “quadrangle boundaries” and you will the following results. Scroll down to find an item named USGS 24k Topo Map Boundaries, which a layer package, and that’s what we want.
To download it locally, just click the arrow next to Open and choose Download, as shown below:
Now you’ve got a local copy of the originally shared layer package from ArcGIS Online, and are ready to add it to your map.
You can find the layer in a folder named ArcGIS under My Documents, inside that folder, a sub-folder named Packages has all the layers downloaded from ArcGIS Online.
Making a Simple Point Map from locally-stored Data
To create a point map, a data source is required. You can upload data sets from your computer to ArcGIS Online.
You can click HERE to download two zipped files, each contains a data layer (historical landmarks and schools in Austin) to your computer. You do not need to unzip them.
ArcGIS Online is capable of reading zipped shapefiles, CSV, TXT, and GPX files as layers. In every case, each layer is limited to 1000 features. Additionally, a new map document can be made from a single KML file, with the option of adding other layers on top.
As previously mentioned, files or services from the Web can be added as layers using a URL. Data can come from an ArcGIS Server, an OGC Web Service, a KML file, or a CSV file.
To get started, go back to ArcGIS Online homepage and from the main toolbar click MY CONTENT.
And then from the main page click Create Map.
From here you will be taken to a blank map document. In the top toolbar, select Add.
A drop down menu with four options will appear. Select Add Layer from File.
Once the dialogue box opens select Choose Fileand navigate to the two zipped control point shapefiles you downloaded. After choosing the correct file, you will be presented with the following options:
Because shapefiles can contain very large amounts of information with a high level of geographic accuracy, the files can be large enough to slow down the speed at which they are rendered. To remedy this issue, select Generalize features for web display. Under normal circumstances, and in most applications, this should not lower the accuracy of the data in a meaningful way.
In this exercise we will let this option default.
Select Import Layer and repeat for the second zipped shapefile.
Once you are done importing you should see something like this:
Customizing the Map
You will probably notice there is no way to distinguish between the two datasets, since they both look the same.
Also, when you click on a point not all fields contain information that you necessarily want to see on the map. Fortunately, ArcGIS Online allows the user to customize many aspects of the map.
To get started, click the Show Contents of Mapbutton (middle button) on the top of the toolbar on the left side of the screen. This is the table of contents of the map, and lists all layers present.
Mouse over the schools_austin layer and click the arrow to the right. You will be presented with the following options:
Click Change Symbols. A bar will pop up on the left side of the screen.
The options here include A Single Symbol, Unique Symbols, Color, and Size.
Since we want to use a single symbol for each dataset, we will let the Use field default to A Single Symbol.
Select a Single Symbol and click Change Symbol. Scroll down and find the green dot that matches the existing red one. Change Symbol size to 20px.
Click Done and notice the changes on the map. It is now easy to distinguish between the two layers as they now are differentiated by color.
Next, we will configure the pop-up boxes used to identify points on the map. Click on the X to close the Change Symbols bar. Click on the arrow next to the schools_austin layer, but this time select Configure Pop-up. A window will appear on the left side of the screen.
Select the Configure Attributes button. Here you can change whether or not a field displays, and also what name it displays as.
In the Display column, deselect the fields that you do not want to display in the pop-up.
elect OK to close the window, and make sure to select Save Pop-Up on the Pop-up Properties window.
Now click any school, only selected attributes are displayed in the pop-up.
Sharing the Finished Product
Before the map is actually shared, you have to save your map. Click Save.
Type in a proper title, also put in at least a tag for keyword searching. Click Save Map.
Then click on the My Content tab near the top of the page. Click on the map you just created.
To change the permissions for map sharing, on the top bar, click the Share button. The following window will open. (Note that you will not see any group information unless you belong to one or more groups.)
From here the permissions of the map can be changed to Public or shared with a group. By default, all new maps are private, meaning only the creator can view them. Setting the privacy to Public allows everyone on the internet to view your map, whereas sharing with a group allows only group members to view the map.
Mobile Maps
ArcGIS Online has the ability to take your map with you on your smartphone or tablet. Apps currently exist for Apple iOS, Android, and Windows Phone 7.
The app gives users the ability to view their current location on the maps they have created.
For this exercise, Android version of the app will be used.

Once the app is downloaded, the user will be greeted with a home screen.
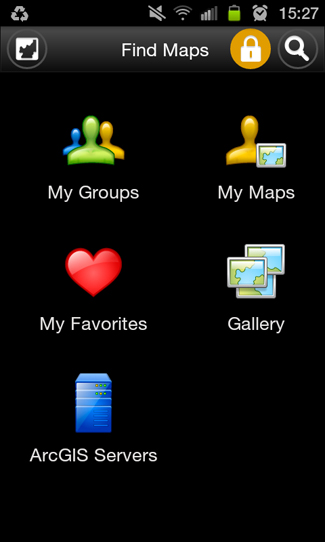
Login to your account.
Select My Maps and open the map you just created previous on ArcGIS Online.
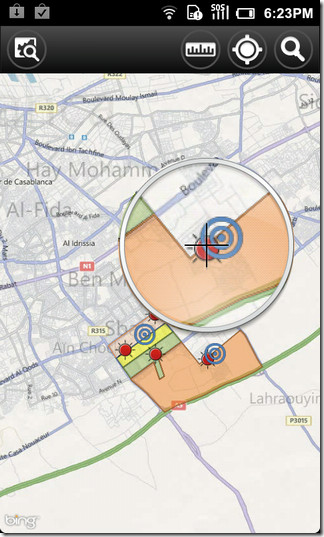
There are a few icons across the top: the map with a magnifying glass will take you back to the My Maps folder, the ruler icon will allow you to measure distances, the GPS logo will identify your location relative to the map, and the magnifying glass will allow you to search places on the map. Just like the native mapping application on your device, the ArcGIS app allows panning and pinch zooming.
Since an Android device is used in this example, selecting the device’s options button will show this screen:
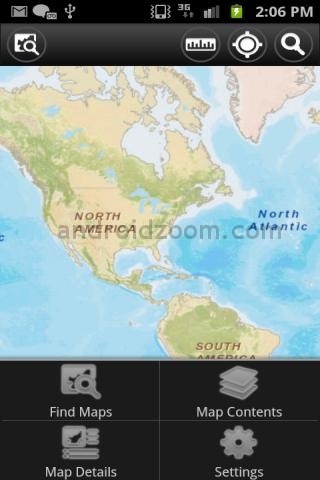
Find Maps will redirect back to the home screen whereas Map Contents will allow you to view the layers of the map and toggle their visibility.
Selecting Map Details allows users to view all the metadata they added earlier in the exercise.
The deliverable:
No assignment is due.
Reference:
- SCO Technical Paper "Creating Web and Mobile Maps Using ArcGIS Online", John J Czaplewski, University of Wisconsin
- ArcGIS Resource Center - Esri.com
prepared by Ming-Chun Lee, 03/24/2016
|