| |
GeoDesign
Tutorial 4 - Raster analysis
Tutorials 2-4 are three parts of one large task. In these three tutorials you will use queries, theme modification, overlay functions and some raster analysis to select a site for a new fire station.
In Tutorial 3, you used GIS functions to methodically determine what sites would be suitable for a fire station, based on some minimum criteria. In this exercise, you will prioritize these potential locations based on current service needs, as reflected by the distances to the nearest fire station across Seattle.
A. SETTING UP YOUR PROJECT
- Open again your ArcMap project file, which you have been working on since Tutorial 2 .
- Turn on the following layer:
- Municipal Boundaries
- move this layer to second-to-top in your Table of Contents, just
underneath the Fire Stations Layer
- Since this layer contains not just Seattle city boundary but also
other surrounding cities' boundaries, you have to use "select
by attributes" to select only Seattle boundaries.
- In the Selection menu, click on Select by Attributes,
in the query window, select munibound layer and
choose to create a new selection, set the query as the following:
- "JURIS" = 'Seattle'
- click Apply then OK, then right
click on the munibound layer and choose Data
> Export Data, name the new layer "seattle".
Clear selected features before move on.
- Make sure the Spatial Analyst extension is activated:
in the Customize menu, select Extensions....
In the list, make sure that there is a check-mark in the box next to Spatial Analyst, then click Close.
- Make sure the Spatial Analyst toolbar is showing. If it isn't, then
go into the Customize menu and select Toolbars >
Spatial Analyst.
- Some option we need to change are the analysis mask and the extent for new raster layers. When we start creating raster layers, ArcMap
doesn't initially know how far we want our calculations to go, so we
need to specify that. We also need to specify that we only want values
calculated for areas within the city limits; cells outside the city
limits but within the extents of the rectangular-shaped raster layer
will have "null" or "NoData" values.
Click Geoprocessing menu, then select Environments...
Under the Processing Extent, change Extent to Same as Layer seattle.
- Under Raster Analysis, set the Mask to seattle .
- Click OK to save these options.
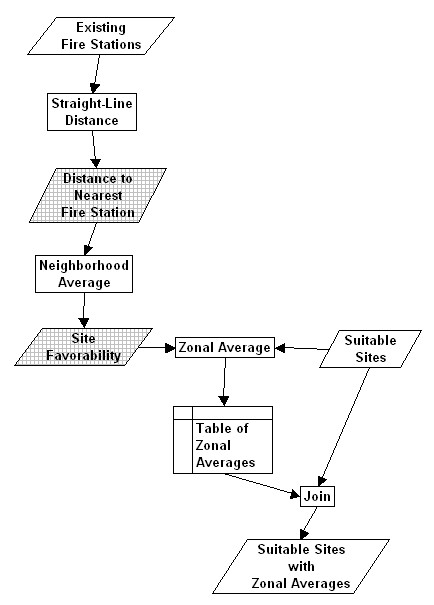
The flowchart below summarizes all of the steps you will be taking in
this exercise:
B. PROXIMITY TO FIRE STATIONS
The first step is to create a raster file representing the distance to
the nearest fire station for every location in Seattle.
Since we're talking about every location, what we really mean
is a continuous surface where higher values indicate
that the nearest fire station is far away, and lower values indicate that
the nearest station is quite close. And of course, since we want a continuous
surface, we decide to create a raster layer.
- In the ArcToolbox, select Spatial Analyst > Distance > Euclidean Distance.
You should see the following dialog box:
Set the Input Raster to Fire, set the Output cell size to 100,
and give your Output Raster a name firedist. Be sure to save
it in your own folder.
- Click OK to create the new raster layer.
- The new layer will be automatically added to your ArcMap project.
Note that you see distinct bands surrounding each fire station. These
bands each represent a discrete range of values for "distance to
nearest fire station", but remember that the data embedded in the
raster file is continuous, not discrete. The discrete bands are simply
due to the default symbology settings.
C. GENERALIZING THE PROXIMITY DATA
What we know now is the fire-station-distance data for every discrete
location in Seattle. However, it might be a bit extreme to simply pick
a location that has the highest distance-value in the City, because there
may be a huge cluster of rather high distance values somewhere
else. So what we really want is sort of a "moving average"
of fire-station-distance that takes into account not only what's going
on at a specific location, but what's going on in the general vicinity
of each location. For that, we use a "neighborhood function"
that averages the fire-station-distances for all cells within a moving
window centered on each cell. We can then interpret this as the favorability
of a potential site for the new fire station, since we would like a site
in a neighborhood that is underserved - i.e. has high distances to the
nearest fire station.
- In the ArcToolbox, select Spatial Analyst > Neighborhood > Focal Statistics.
You should see the following dialog box:
Enter the values shown in the image above, except give the Output raster a name firedist_mean and location in
your own folder .
- Click OK to create the neighborhood-average distance-to-fire
station raster file.
- The new layer will be automatically added to your project. The color
scheme will vary.
The Table of Contents will tell you which colors indicate high and low
values for neighborhood-distance-to-fire-stations.
(Please click HERE to download this raster layer, if you are not able to complete this step)
D. ASSOCIATING FAVORABILITY DATA WITH THE SUITABLE SITES
In the last step, you will merge your raster layer of neighborhood-distance-to-fire-station into your vector layer of suitable sites.
Now, to integrate the raster data into the Suitable Parcels layer, we
will use a "zonal function", where all raster
cells within a given polygon are averaged.
- In the ArcToolbox, select Spatial Analyst > Zonal > Zonal Statistics as Table.
You should see the
following dialog box:
Enter the values shown in the image above, except give the Output table a name zonal and location in
your own folder.
- Click OK to compute the suitable-parcel-zone averages
of the neighborhood-average-distance-to-fire-station variable.
- When it's done, you should see a table summarizing the zonal stats (including average, max, min,
etc.) for all suitable parcels is added in the table of contents
- Open the zonal stats table, right-click the header MEAN, choose Sort Descending.
- Which parcel (using its identifier)
has the highest neighborhood-level distance to the nearest
fire station? (Look at "MEAN" in the summary table, the field "FID_VACANT" has all the parcel identifiers)
- Close the table, then look back at your map.
- Right-click on the name of your layer of Suitable Parcels (VacantParcels10K),
then select Open Attribute Table.
- Find the field name FID_Vacant, then scroll
down until you see the unique identifier that you wrote down in Step
5 above. Select that row in the table (by clicking on the most-left
cell in this row), then close the attribute table.
- Your selected parcel should now appear on your map of Seattle as
a small polygon outlined with a thick light-blue line.
Save your project file in your project directory.
The deliverable:
In a Microsoft Word document, please include the following:
- A JPEG map of Seattle showing:
- The set of suitable sites with the best site selected and highlighted with the light-blue line,
- The locations of all existing fire stations,
- The raster layer showing the neighborhood average for distance-to-nearest-fire-station (the result of Part C), and
- The Water Bodies layer to provide geographical context.
The assignment is due on Sep 29. Please submit it to Moodle.
prepared by Ming-Chun Lee, 08/24/2015
|