Home |
 |
GeoDesign Tutorial 1 - Data Sources & Building a GeoDatabase Objectives:
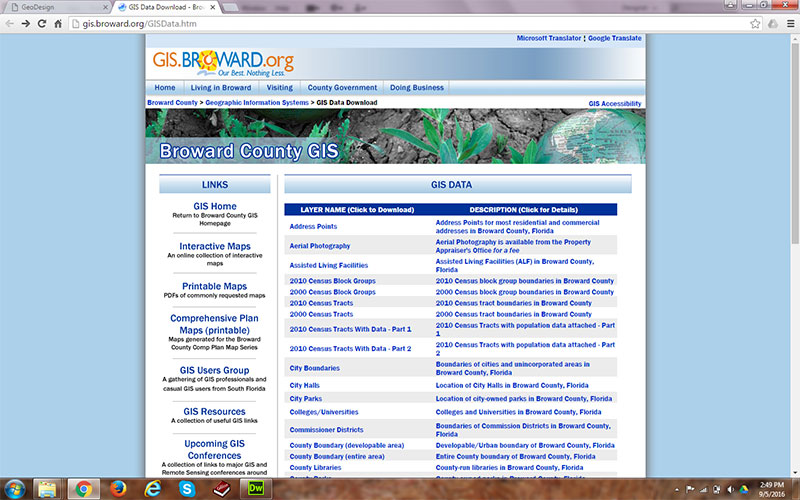
Visit Broward County GIS Data Broward County GIS Data Center (BCGDC) host a data repository containing a number of GIS data sets. The web site is http://gis.broward.org/GISData.htm (a new browser window/tab will be opened). For the rest of this exercise, we will refer to the site simply as BCGDC. You will most likely be using data from this repository for the rest of the semester. Click the link above and Open a new web browser and navigate to BCGDC.
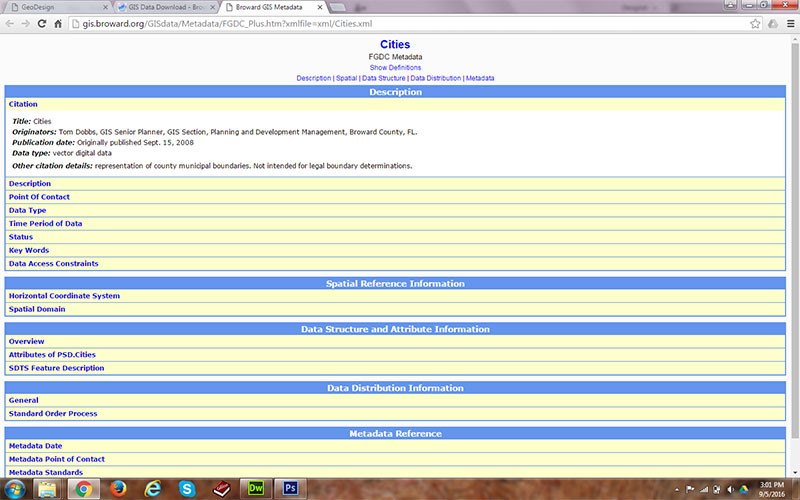
BCGDC provides mostly vector data (e.g. point, line, or polygon) in the ESRI shapefile format. They are also zipped. You need to unzip these files before use them in ArcGIS. They also provide links to some of the raster data (e.g. orthoimagery, digital elevation models, etc) offered by other agencies. Viewing metadata To view metadata (a description of the data set), click the Desceiption link next to each of the data links. The metadata are very important because they (should) tell you all about the data source, e.g., what it is, where it came from, what the fields and values in the attribute tables mean. For certain data sets, the metadata files are not linked directly, it takes a few clicks to find metadata on the data source you are interested in. Also, different data sets are linked to different versions of the metadata records system. Hover the cursor over the Desceiption link for the data set City Boundaries. Click the link for this data set. This will open up another window or tab showing you all information currently available about this partcular data set.
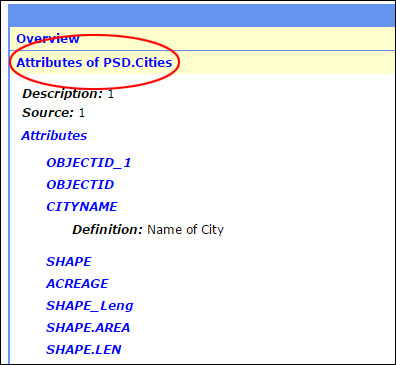
You can find five tabs on the top of the page right below the title of the data set. the first one "Description" has information about the data source, such as what it is, where it came from, when it was created. The second one "Spatial" contains information about this data set's spatial reference (i.e., coordinate systems used for the data set). The third one "Data Structure" overviews some important information of all attributes in the data set. Click the link "Attributes of PSD.Cities", a list of short descriptions of all attribute in the data set can be found here. Although not very detailed.
Extra notes:
The metadata system may get rather clunky to work through, but becoming familiar with the data is important. If you need to know what the values in your data's attribute tables represent, metadata are critical. Download Data Sets In this part of the exercise we will download a few data sets from BCGDC, which may be commonly used in this class. We will initially save the data on
the computer's hard drive. After downloading and unzipping or importing we
will clip the data to the city boundary (city limit) for City of Oakland PRK and then save them on your USB
drive or the shared server space in H: server. Unzip Data Sets Before anything can be done
with the files in the GIS, they must be unzipped.
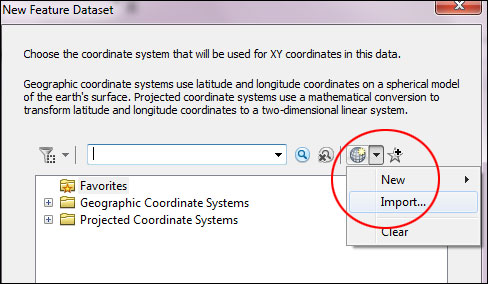
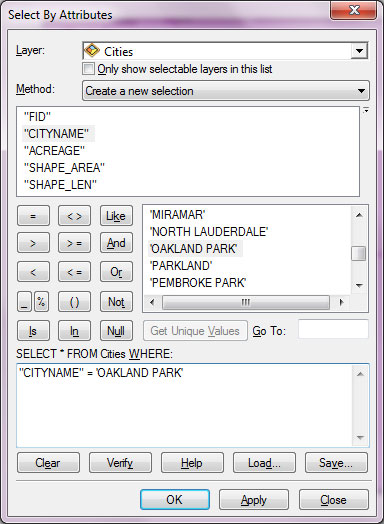
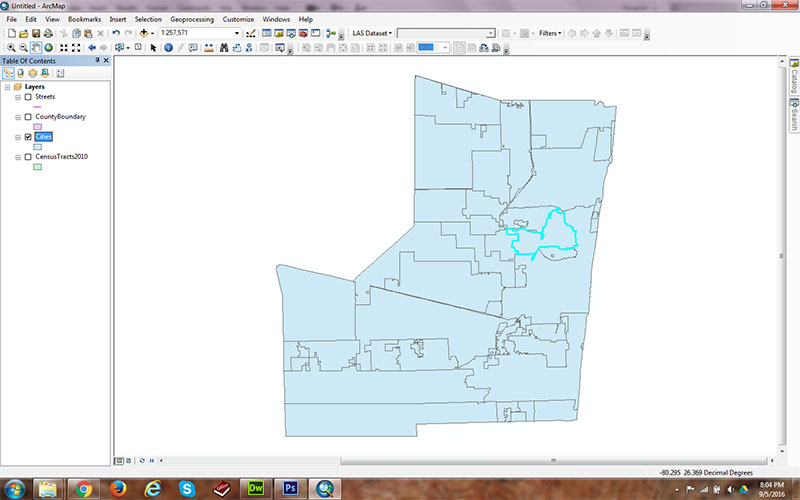
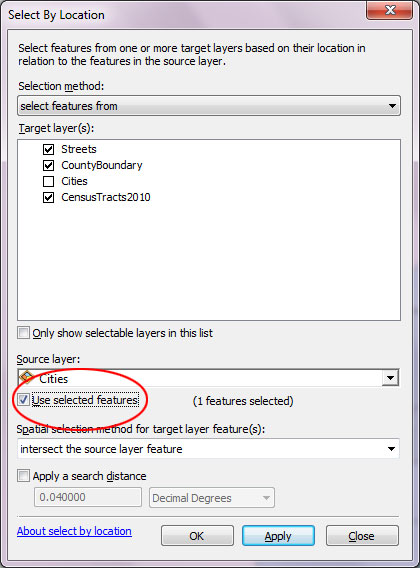
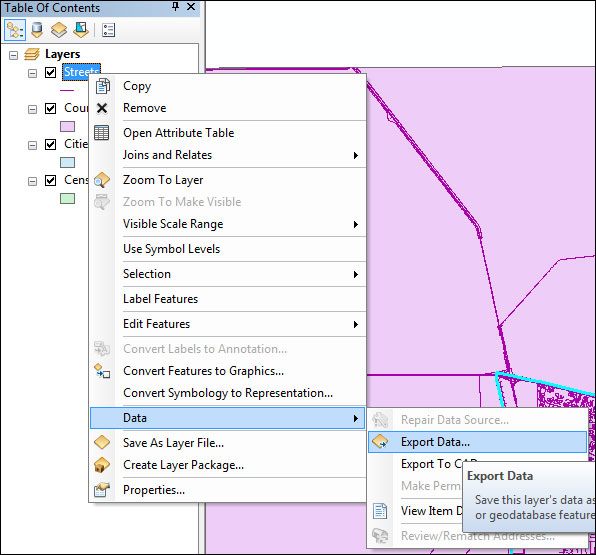
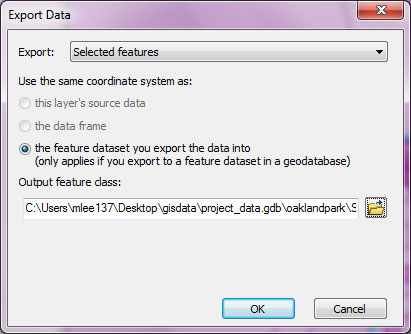
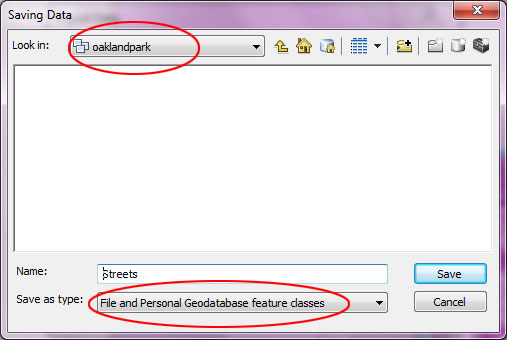
Do the same for other zipped files in the Desktop\gisdata directory. Create Geodatabase and Clip datasets We will focus on the area within City of Oakland park Boundary, so the data sets for BCGDC need to be clipped. Rather than clipping like a cookie cutter, we will create new datasets that consist only of features that overlap with the city limit. Start by adding all the BCGDC data to a data frame in ArcMap.
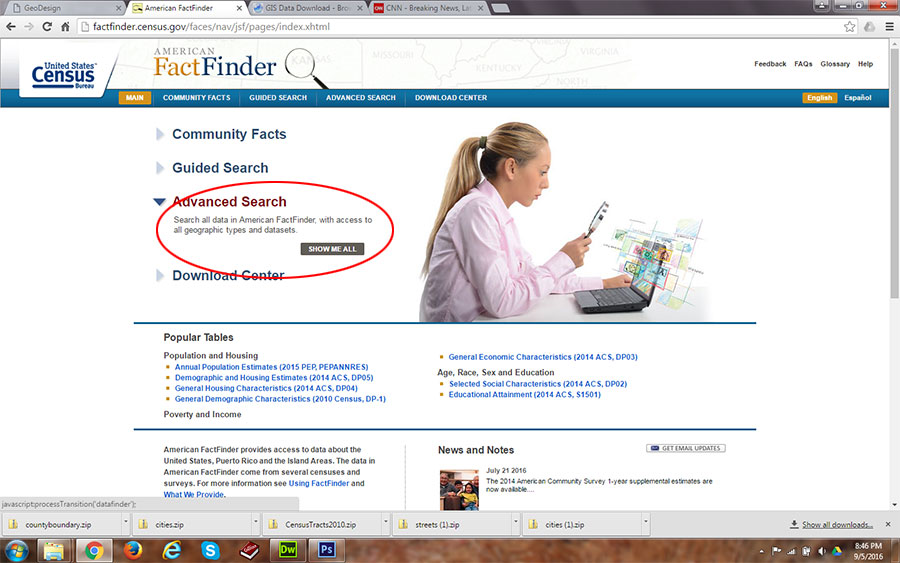
Getting Census DataFor this exercise, you will find using Firefox or Chrome is much more problem-free than using Windows IE. IE's pop-up blocker for some reason prevents us from downloading census tables proeprly. Please use Chrome to work on this exercise. First go to: http://factfinder.census.gov/faces/nav/jsf/pages/index.xhtml
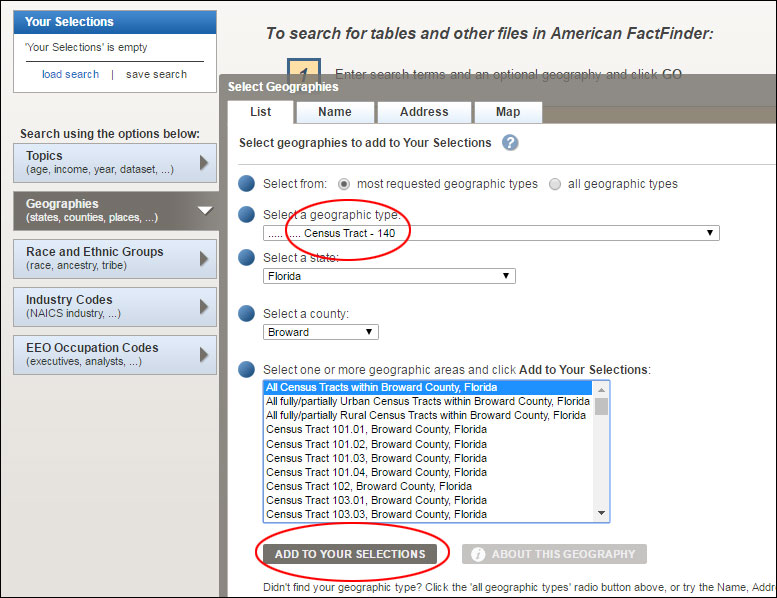
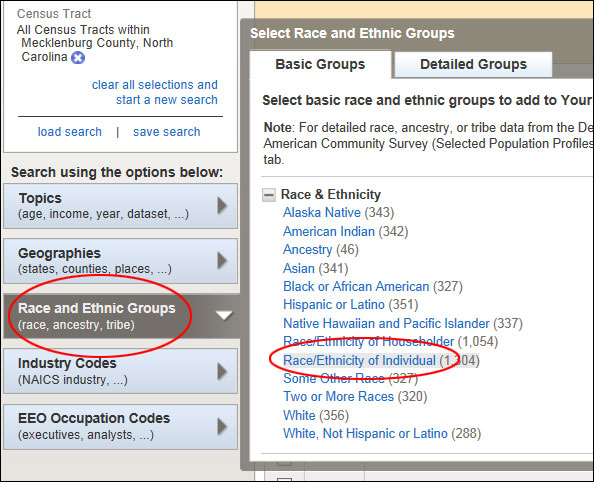
Click Geographies to set the geographic limit and units for which you want to get the census data out. First click Census Tract from the Select a Geographic Type list in the window. Then click Within State from the list. Then choose Florida from the list to refine your filter. You have just added another geography filter. Now click Within County from the list and select Broward from the list. You added another geography filter to further narrow down the geographic extent for viewing/downloading census data. Then Click All Census Tracts within Broward County in the box then hit the button Add to Your Selections.
Then click Race and Ethnic Groups, choose Race/Ethnicity of Individual from the list. After that, clicking the X button on the top-right corner of the "Select Race and Ethnic Groups" window to close it.
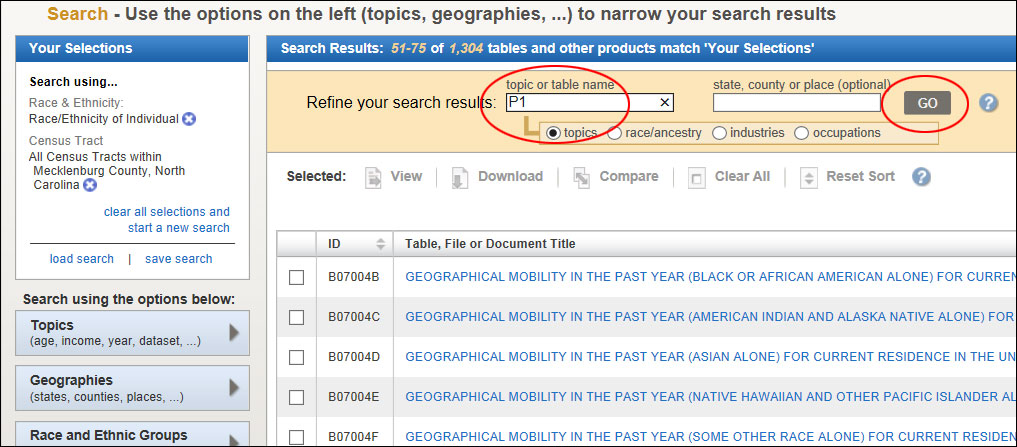
You will see many census tables are available under this category. typing in "P1" in the search box, then click GO, as shown below in the image.
You should now see P1 on the list. Check the box next to it.
Now you can start to download this particular census topic from the website. Click Download button (both on the top and bottom of the table).
Click OK when see the message below:
Then in the next message box, click DOWNLOAD.
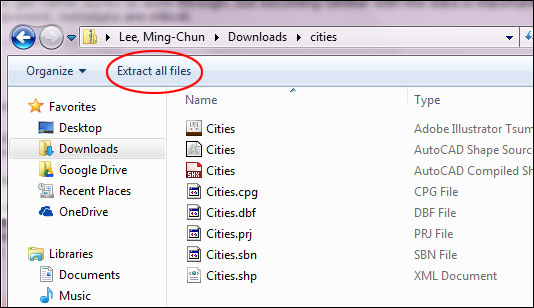
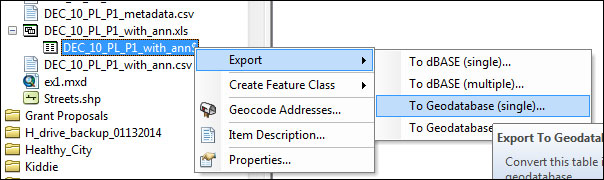
Extract all the files in the zip file to your gisdata directory. There will be two Excel files listed as being zipped in the file. Make note of what the variables represent, and eliminate the second row of the Excel file (with all of the descriptions). You have to adjust the format for the second field, GEO.id2, to make it consistent with what is typically used by GIS data. Please see tutorial 1.5 for more information. You may want to save your file as an Excel 97-2003 Workbook (.xls). Re-open ArcCatalog, connect to your gisdata directory, click the small + in front of the excel file DEC_10_PL_P1_with_ann.xls, you should be able to see the worksheet DEC_10_PL_P1_with_ann$, this is where your census data is stored. Right-click this worksheet, then choose Export > To Geodatabase (single)... This will be used to copy your census data table into the geodatabase.
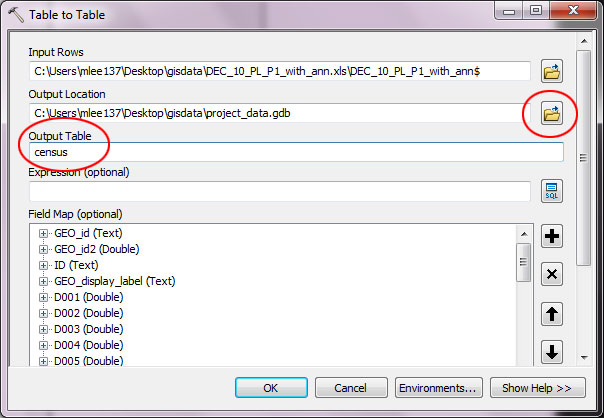
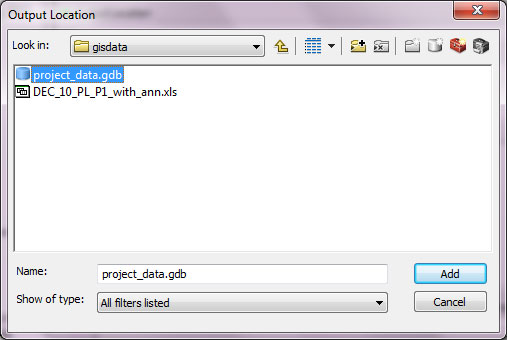
For the Output Geodatabase, click the folder icon and navigate to the project_data.gdb geodatabase you created. Do NOT double-click the geodatabase, just select it and click Add. Click OK in the tool dialog.
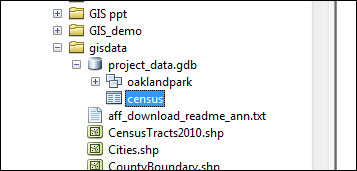
Name your output table, such as census. Click OK to finalize the process. Now you can double-click your geodatabase in the directory tree, and you should be able to see your census table there in the geodatabase.
Delete all of the zipped files you downloaded. Then copy your file geodatabase to your USB drive or you can create a temporary directory in H: server and store all your files there. Exercise 1 - Building a GeoDatabaseThe deliverable:Your assignment is to complete the following task: Please go ahead to download more shapefiles from BCGDC and add them into your project_data.gdb geodatabase. You do not need to turn in anything, but be sure to complete this task by Sep 15, 5:00pm. prepared by Ming-Chun Lee, 09/05/2016
|