HomeExercises |
 |
ARCH4050 / ARCH6050 / MUDD6050 Tutorial 8 - Neighborhood Connectivity / Network Objectives:
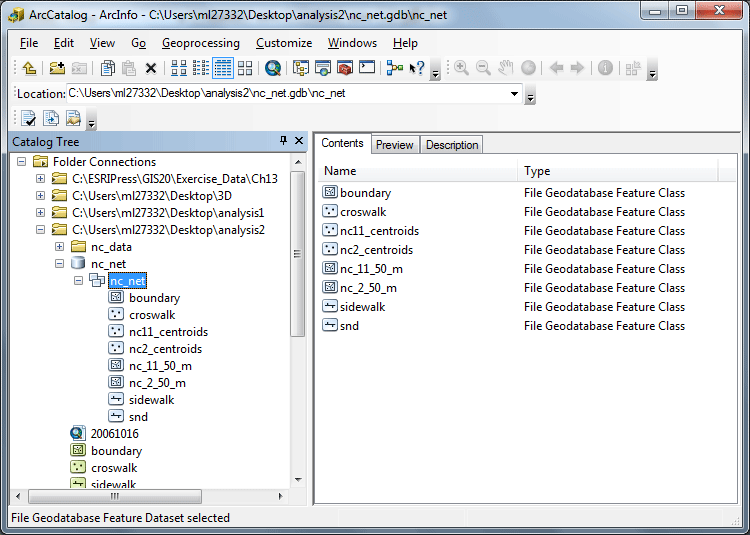
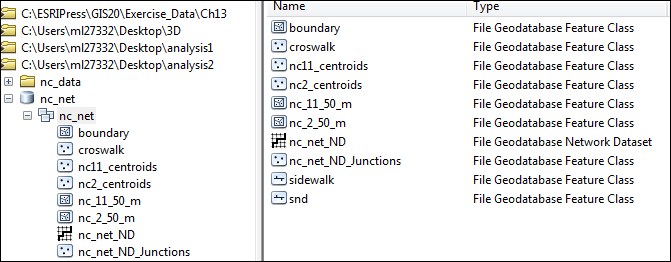
Background:The previous tutorial defined the spatial extent of a neighborhood center (NC) by using minimum convex polygons. However, minimum convex polygons assume a constant spatial access for the entire area. In reality, pedestrians, cyclists, and cars are generally limited to the street network as a way of getting from one place to another. In this tutorial, we will again use the centroids from land use parcels to define a network path among land uses. The distance needed to visit every selected land use within the NC and the area per NC can be used to estimate the "compactness" of the NC. We will also perform overlay operations with other data sets in order to characterize the difference among different NCs, based on density criteria (e.g., sidewalk, crosswalk). SetupCreate a directory on the desktop named it analysis2. Click HERE to download a zip file, which contains a file geodatabase for this tutorial. Save it in your analysis2 directory, then when the download is complete, extract the geodatabase there; you will now have all the datasets in that directory. The file geodatabase nc_net contains one feature dataset named nc_net, which contains the following eight feature classes for the tutorials:
snd - street networks in Seattle You can also find data for two sets of neighborhood centers in Seattle. The two neighborhood center data sets were developed for a project on walkability, and are named and represent different combinations of key land uses:
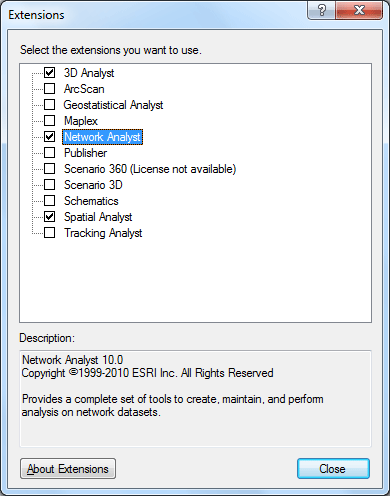
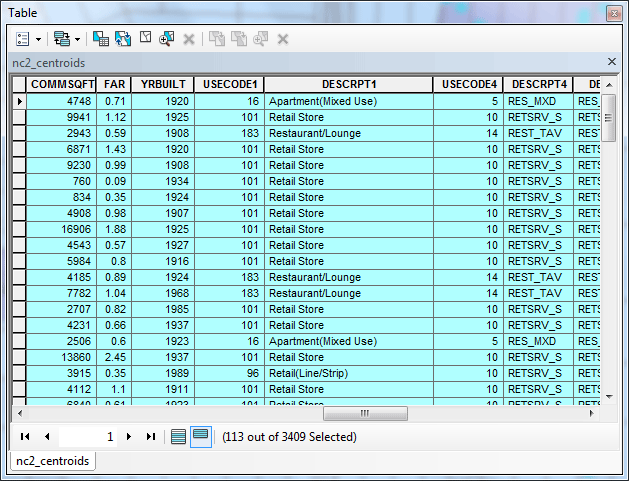
The nc2_centroids and nc11_centroids layers contain centroids for all the parcels with specified land use categories. Set up network analysisThe Network Analyst enables creation of routes (the "traveling salesman" problem), service areas, determination of closest facility for service locations, and origin/destination costs. Open both ArcMap and ArcCatalog, Click Customize > Extensions and make sure the check box for the Network Analyst is checked. Do this in both ArcMap AND ArcCatalog.
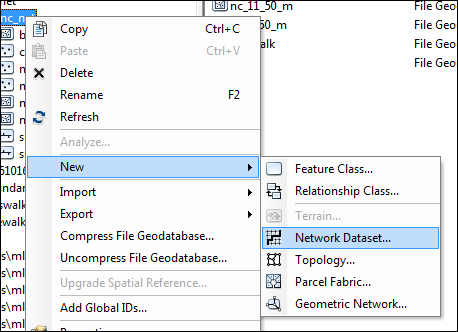
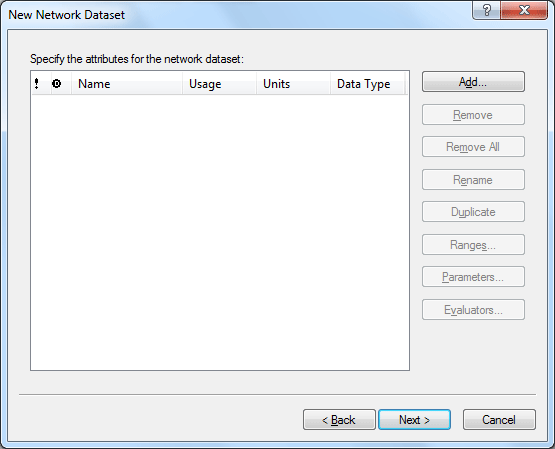
In ArcCatalog, navigate to the file geodatabase, right-click on the nc_net feature dataset, in the menu select New, and then select Network Dataset...
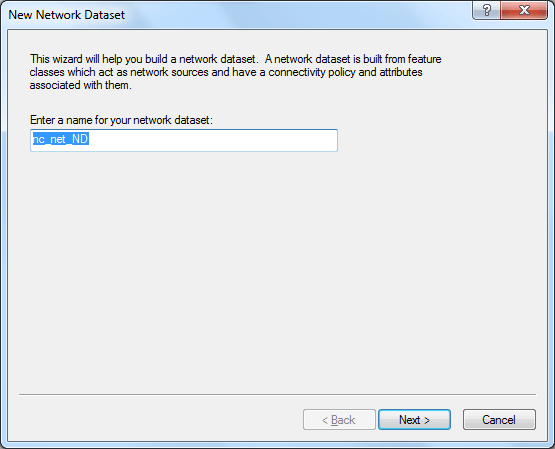
Accept the default name for the new network dataset. Click Next
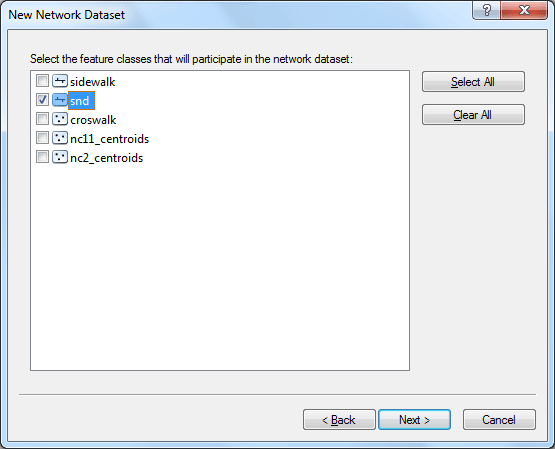
In the next dialog window, check snd layer, which will be the only layer participating in the network dataset. Click Next.
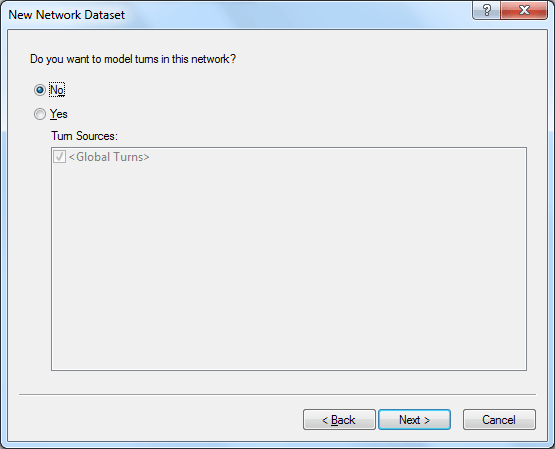
In the next dialog, make sure the radio button for No for modeling turns is selected. Click Next again.
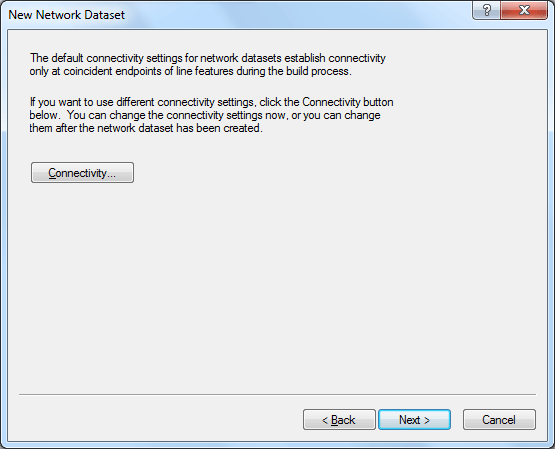
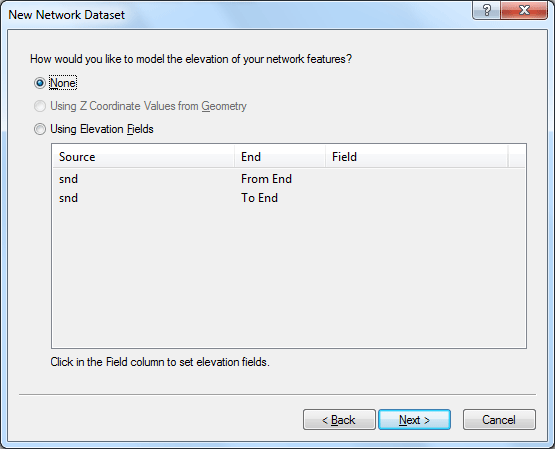
In the next dialog, click Next (do not click Connectivity). Then make sure the radio button for None for modeling the elevations is selected. Click Next.
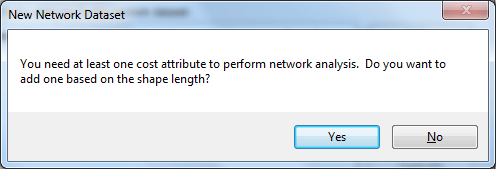
Click Next in the dialog for specifying attributes. Allow ArcGIS to automatically create the cost attribute by clicking Yes
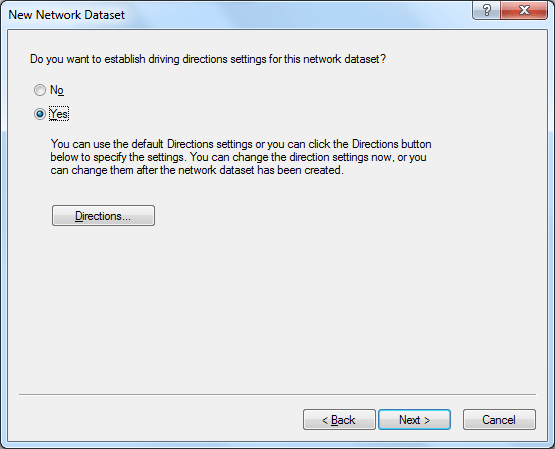
Select Yes for establishing driving directions. Click Next
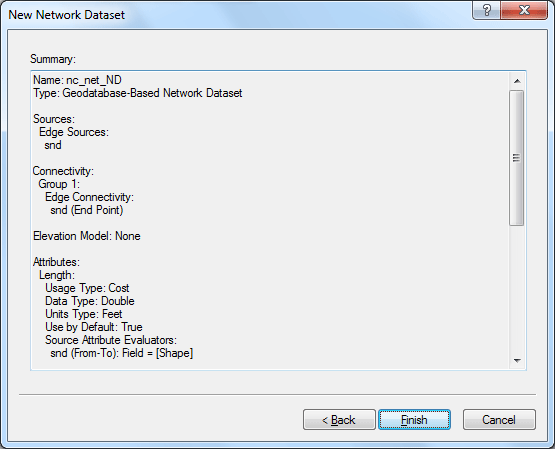
Then you should see a summary of all the settings, Click Finish
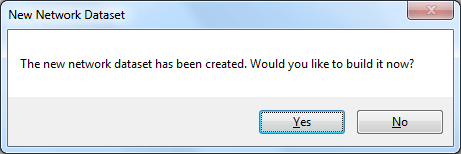
Click Yes to build the network dataset. The network dataset is now complete and can be used to generate network routes based on point locations. You should now have the eight original feature classes, network junctions feature class nc_net_ND_Junctions and the network dataset nc_net_ND in your file geodatabase as you view it in ArcCatalog.
We will then use ArcMap to create routes based on this nc_net_ND network. You now can close ArcCatalog before we move on.
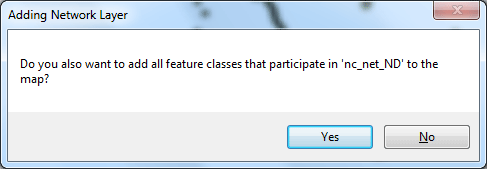
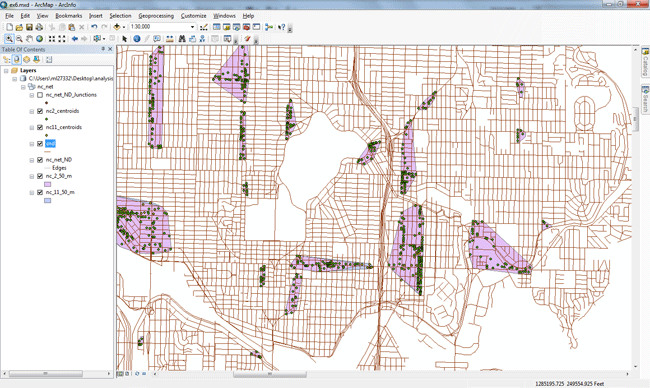
Create networks defined by neighborhoods center parcel centroidsIn ArcMap, open with a blank map. Click Catalog tab to pull out ArcCatalog, navigate to the nc_net geodatabase, add the nc2_centroids, nc11_centroids and nc_11_50_m, nc_2_50_m layers from the nc_net Feature Dataset to the map. Drag nc_net_ND to the map. Click Yes and add the other feature classes when prompted.
Be sure to do save your map often.
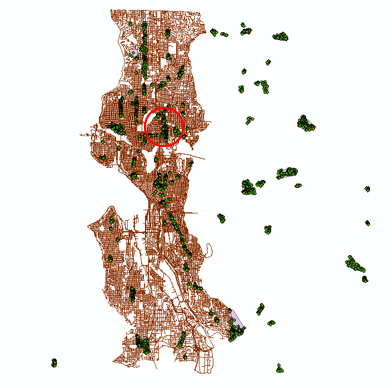
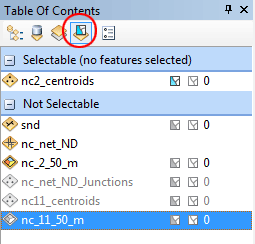
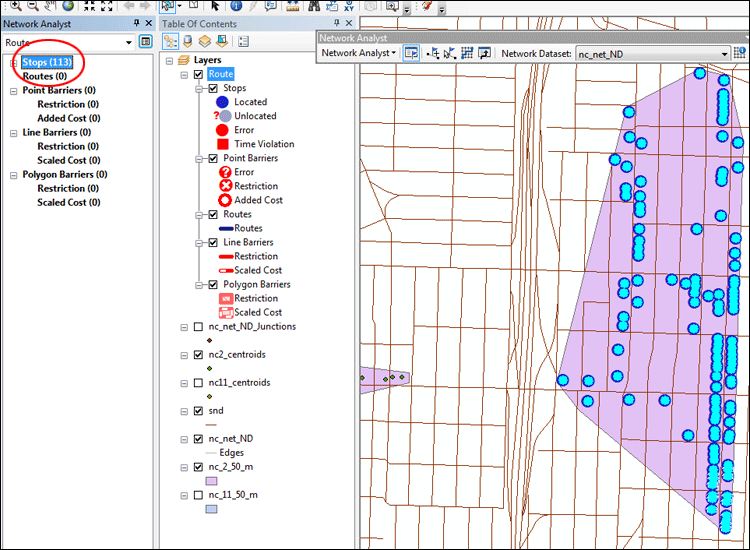
Zoom into the NC in the University District. Turn off the nc11 points and polygons. Now, make only the nc2_centroids layer selectable, click List by Selection icon above the Table of Contents.
Using the Select Features by Rectangle tool
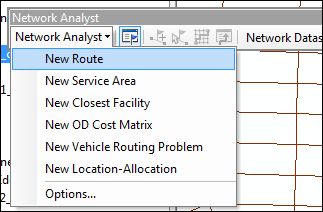
To access the network functionality, click Customize > Toolbars > Network Analyst in ArcMap. Click the Show/Hide Network Analyst Window tool In the Network Analyst toolbar, click the Network Analyst dropdown menu, then select New Route.
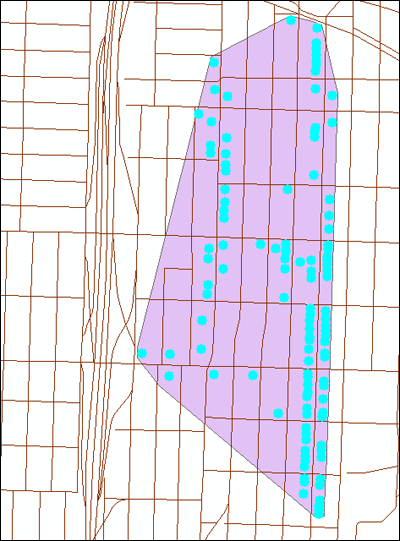
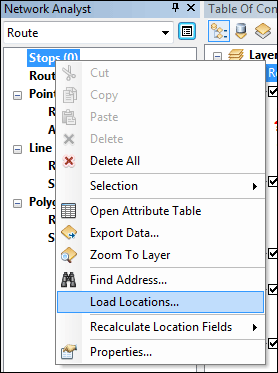
In the network window, right-click Stops and select Load Locations.
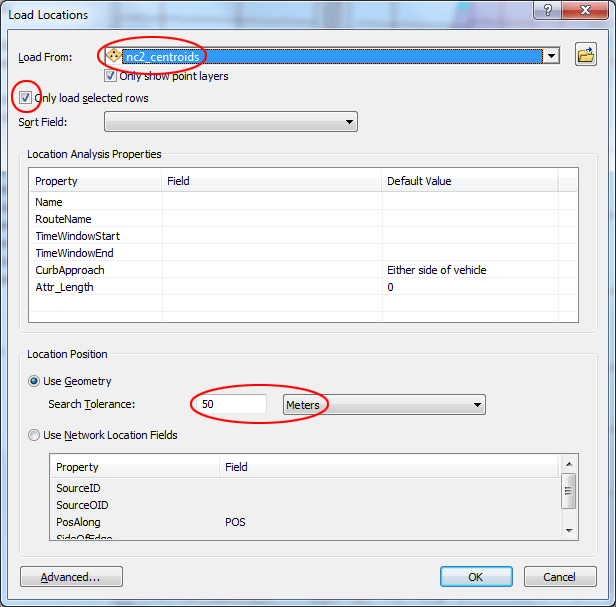
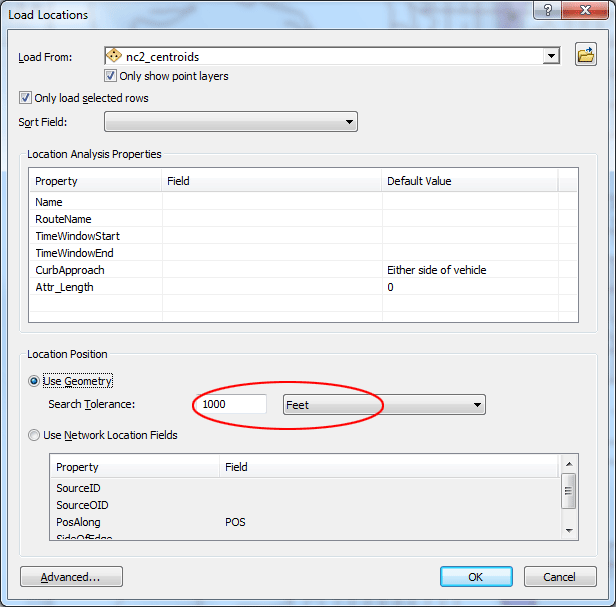
Make sure you load locations from nc2_centroids layer. Also make sure Only load selected rows is checked. Set Search Tolerance to 50 meters, be sure your dialog box looks as it does below (and particularly that the search tolerance units are set to "meters") , then click OK to accept the default settings. You will now see that there are 113 locations added to the stops. Change the network properties, click the Route Properties button
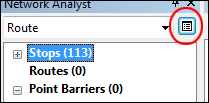
In the layer properties dialog window, Click the Analysis Settings tab. Check Reorder Stops To Find Optimal Route. This means that the route can start and stop anywhere, rather than by the internal order of the point features. Uncheck Preserve First Stop and Preserve Last Stop. Uncheck Ignore Invalid Locations. Click OK.
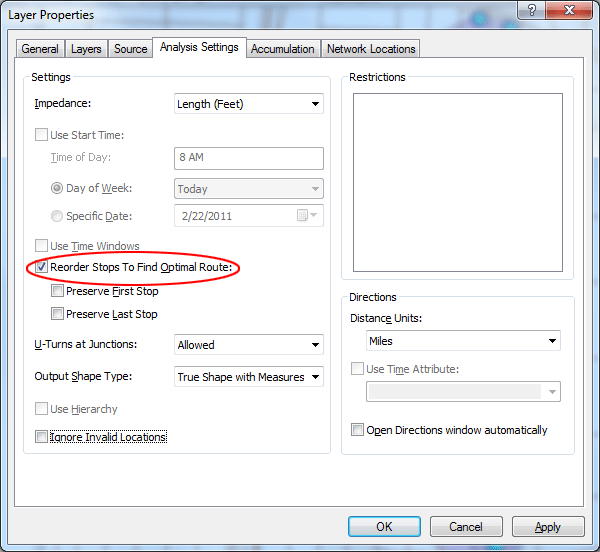
To solve the route, click the Solve button
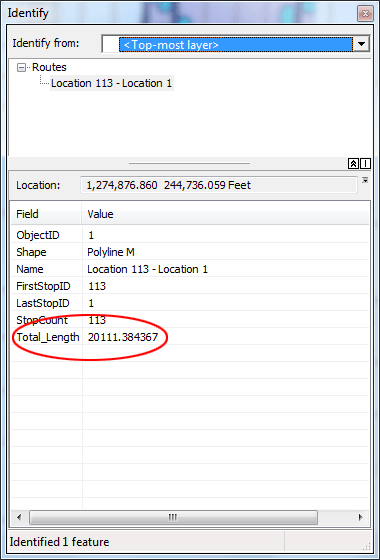
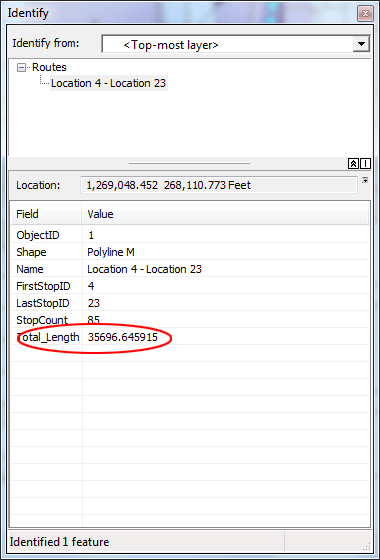
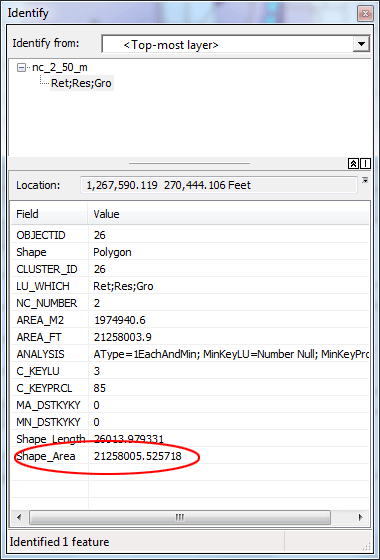
Use the Identify tool
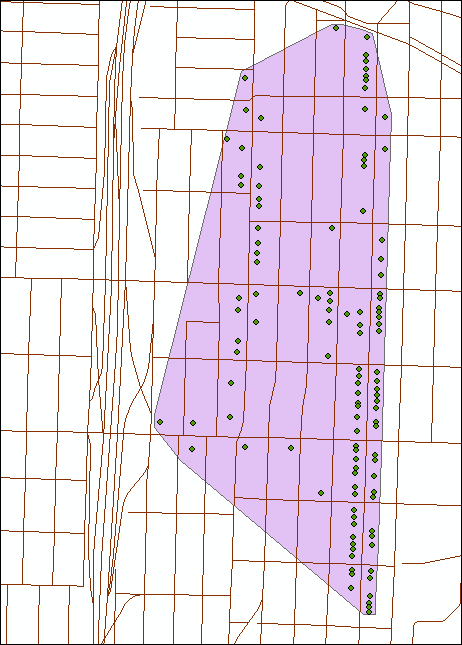
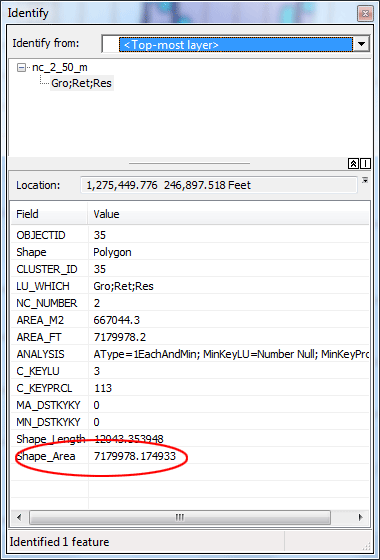
A standard measure that could be used to compare NCs is the ratio of length to area. For this NC,
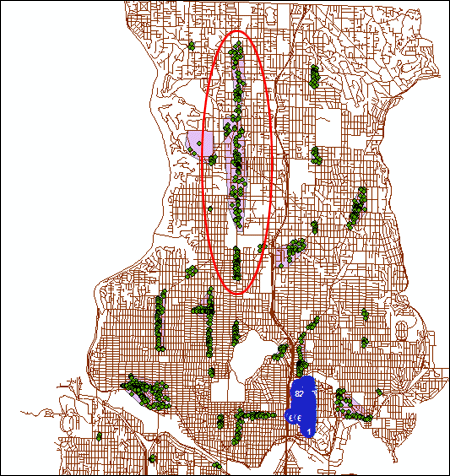
Zoom out in the map view, then zoom in to the NC just north of 115th Street on Aurora Avenue and select the centroids within this NC.
Perform the same steps for this NC, but because of the distance of the parcel centroids to the road network, change the Search Tolerance to 1000 FEET (not meters).
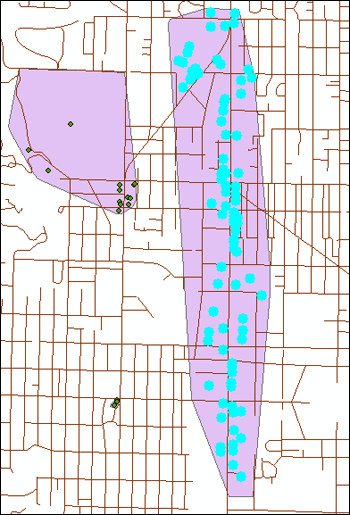
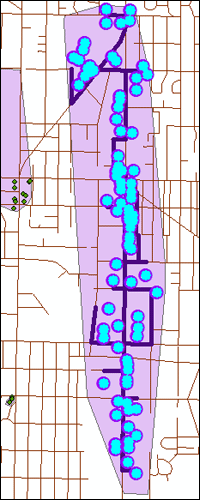
The resultant route looks like this.
This NC measures 0.76 mi^2, and the linear distance is 6.76 mi, with a ratio of 8.89 mi/mi^2. In other words, it takes proportionally less linear distance to cover more area in this NC. With 85 parcels, the other metrics come to 420 ft / parcel and 0.0089 mi^2 / parcel, respectively.
Which NC is considered more compact in terms of access to key activity centers in the NC? Pay attention to the bottom row of the table, see how you can interpret the numbers.
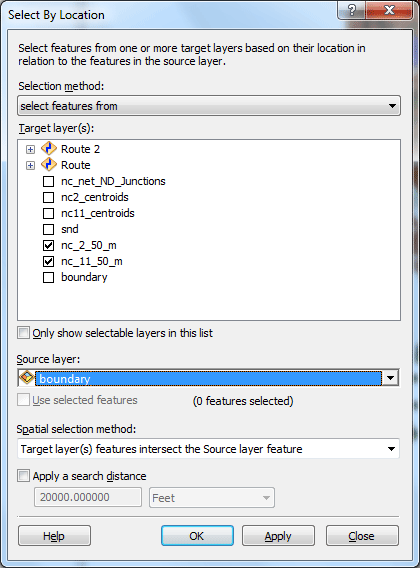
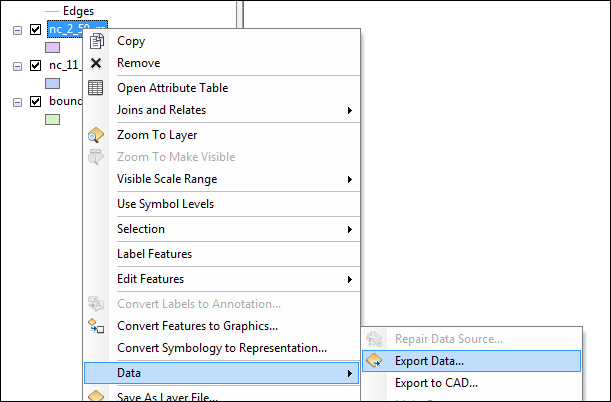
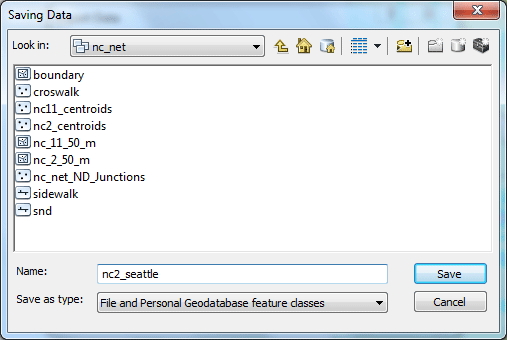
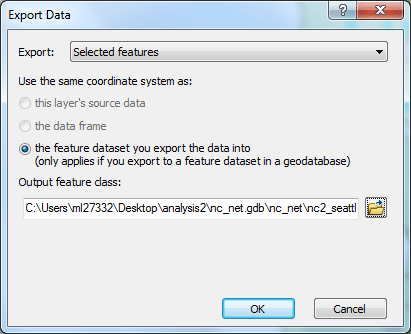
Use overlay analysis to analyze features within the neighborhood centersOverlay analysis is a common type of GIS analysis. It allows you to quantify the overlap between individual features in a polygon layer and features in other point, line, or polygon layers. For example, using overlay you could determine the number of single-family residence parcels within each census tract, the area of industrial land use within commercial zones, the residential density within and without the urban growth boundary, or the length of bike lanes in each jurisdiction. In this exercise we will compare neighborhood centers based on their overlap with various different features from other layers. Most of the layers for which we have sufficient data for this walkability study are limited to the Seattle administrative boundary. Therefore we will limit our analyses only to those NCs intersect with the city limits. Click Catalog tab, drag boundary layer into your map. From the menu, choose Selection > Select by Location. Check off the boxes ONLY for the nc_11_50_m and nc_2_50_m layers. Set Source layer to boundary layer. Click OK. Once the selections are made, export the nc_11_50_m and nc_2_50_m datasets (right-click on the dataset -> Data -> Export Data) to file geodatabase nc_set.gdb feature classes nc_set within the geodatabase, labeling the exported data nc11_seattle and nc2_seattle, respectively. When prompted, add the exported data to the map as a layer:
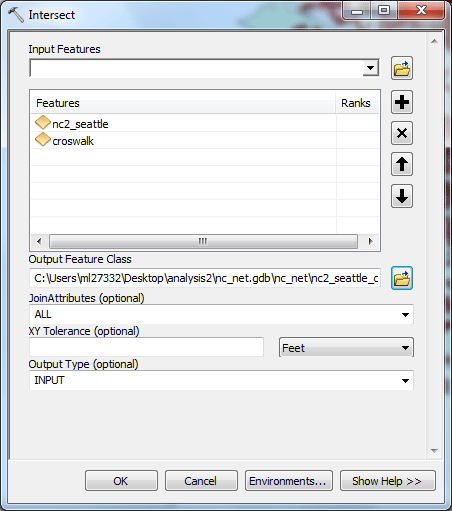
Before we move on, clear all selection by going to Selection> Clear Selected Features Click Catalog tab again, drag crosswalk layer into your map. Open ArcToolbox, select the tool Analysis Tools > Overlay > Intersect.
Use the Input Features pick list to select nc2_seattle and croswalk. Name the output geodatabase feature class nc2_seattle_croswalk
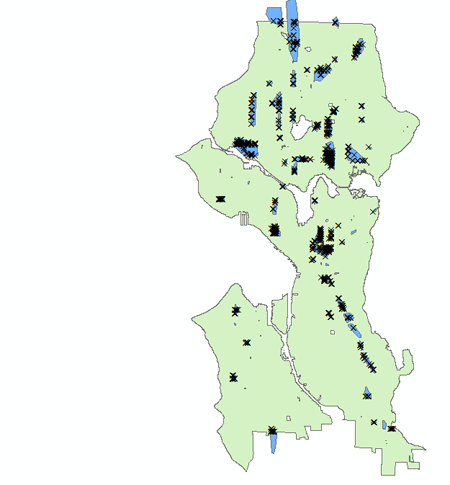
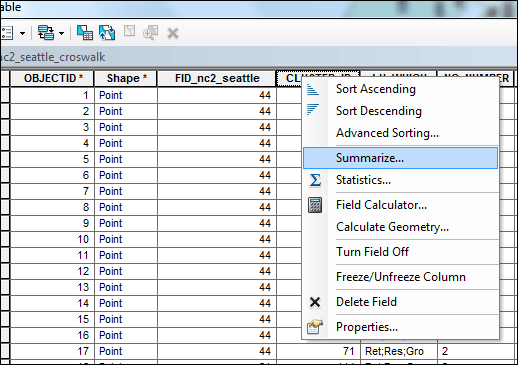
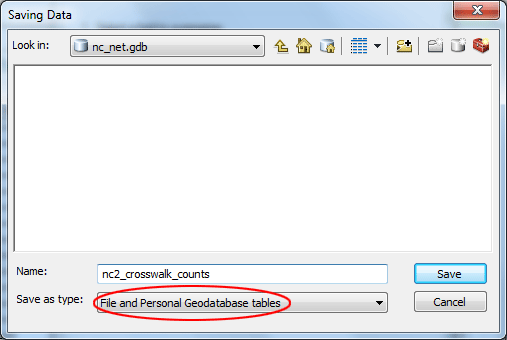
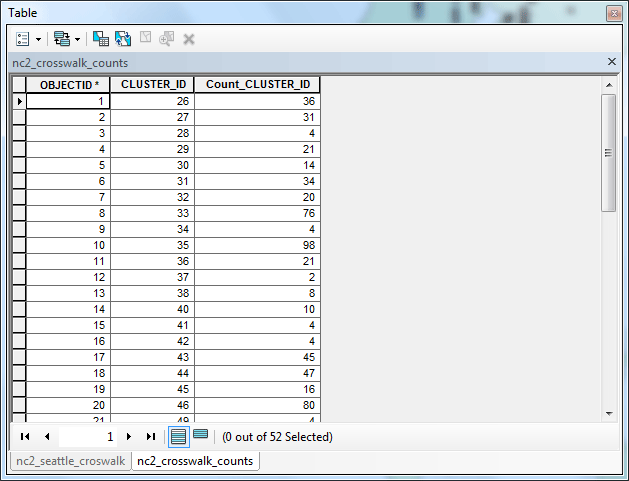
The output data set will have crosswalks, but limited to the areas of NC2 polygons (you can see this by turning off all layers except boundary and nc2_seattle_croswalk, right-clicking on boundary, and selecting Zoom to Layer): Open the table for nc2_seattle_croswalk. Note the field CLUSTER_ID. This is the unique identifier for the NC in which the crosswalk lies. Do not check any boxes, but put the output in the file geodatabase nc_net.gdb. Selecting no summary statistics will simply count the number of crosswalks in each NC. Save the summary table in the geodatabase as nc2_crosswalk_counts (make sure to select File and Personal Geodatabase tables as the file type for saving).
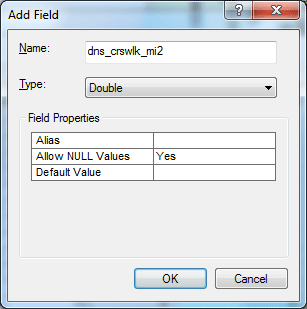
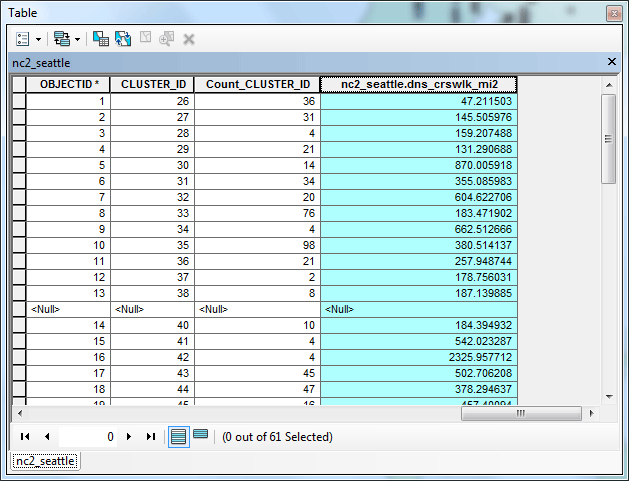
Add the summary table to the map document. Open the output table. The raw number of crosswalks does not tell us much, because each NC is a different size. Close the output table nc2_crosswalk_counts Now open the nc2_seattle attribute table. To calculate the density of crosswalks, first click Table Options > Add Field and add a field to the nc2_seattle attribute table called dns_crswlk_mi2, as a Double field type (use default options).
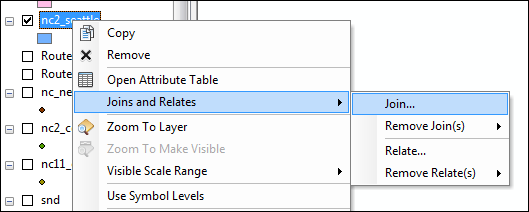
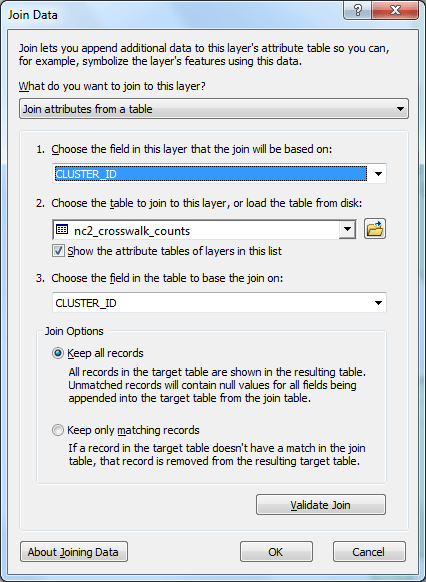
We will now get the count of crosswalks from the output table nc2_crosswalk_counts to the nc2_seattle attribute table. Perform a join of the summary table onto the nc2_seattle table (right-click nc2_seattle in the Table of Contents, select Joins and Relates > Joins).
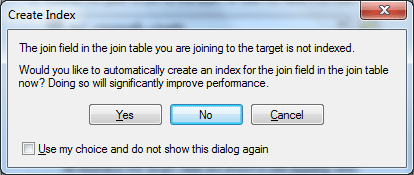
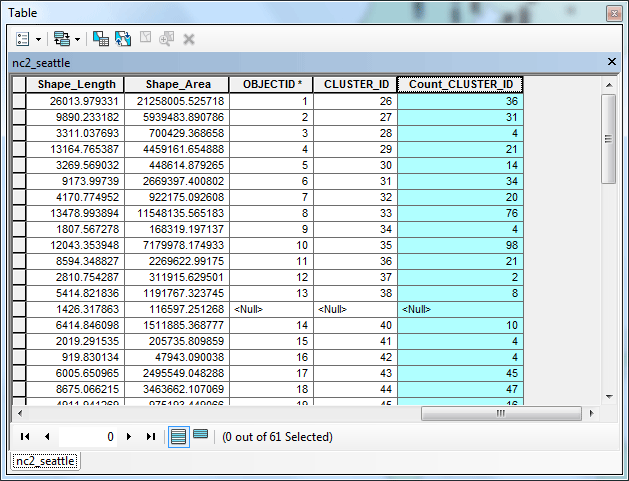
It is not necessary to create the index (if the following dialog box pops up). Now the NC feature table has all the summary table attributes, including the count of crosswalks (in the Count_CLUSTER_ID field)..
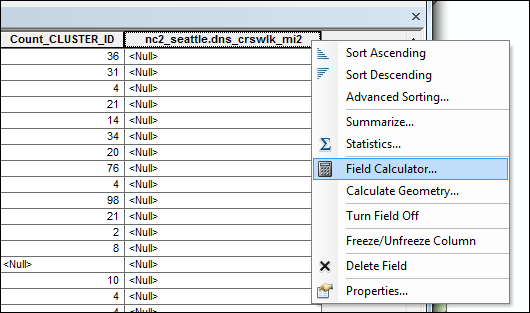
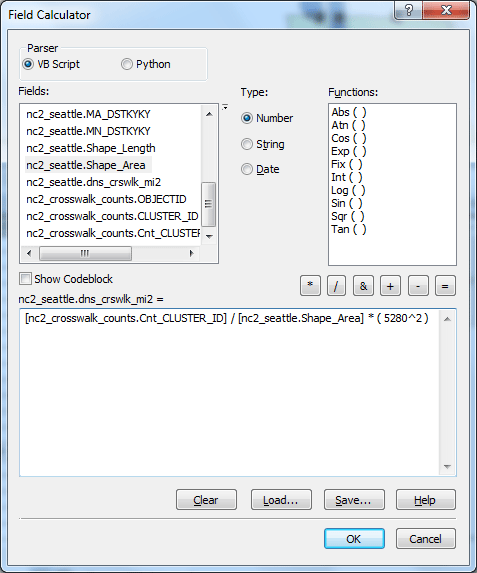
Find the field (scroll back to the right in the list of fields), right-click on the nc2_seattle.dns_crswlk_mi2 column heading and select Field Calculator to determine the count of crosswalks per square mile: set the query as: ( [nc2_crosswalk_counts.Cnt_CLUSTER_ID] / [nc2_seattle.Shape_Area] ) * ( 5280^2 )
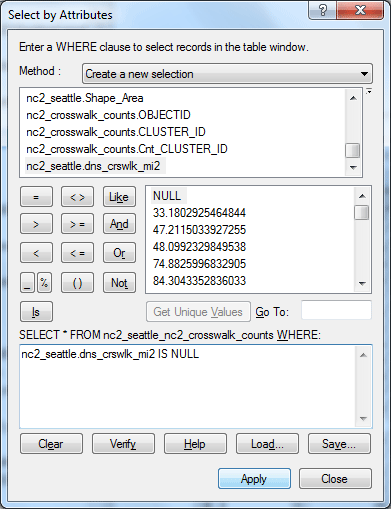
Values that are <Null> are those records that had zero counts for crosswalks within the NCs.
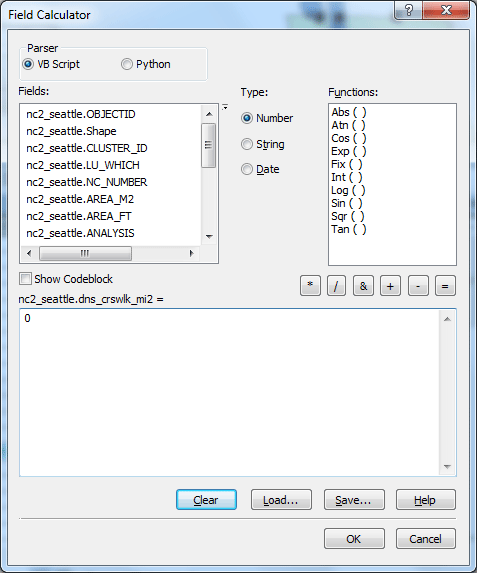
Calculate the <Null> values to zeros by performing the selection by attributes below and then doing another calculation for the nc2_seattle.dns_crswlk_mi2 column:
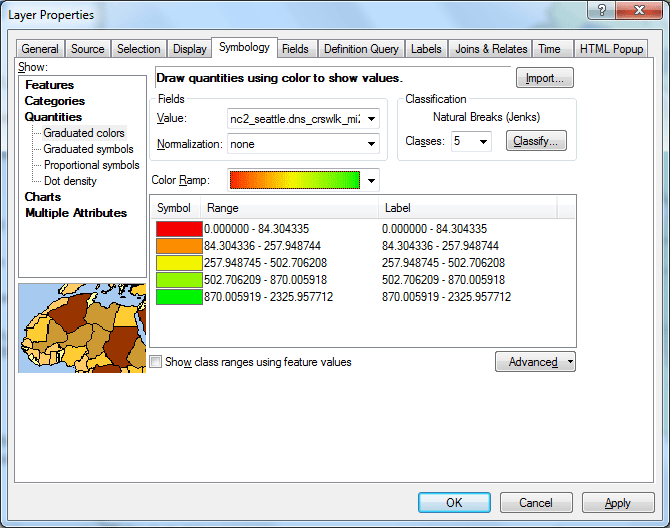
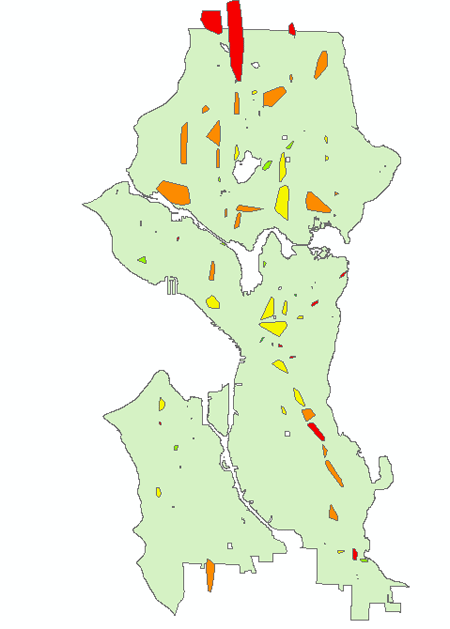
Before we move on, clear all selection by going to Selection> Clear Selected Features The last step will be to alter the display of NCs based on the density of crosswalks. Turn off all layers but boundary and nc2_seattle Double-click on nc2_seattle to open the properties for the layer and click the Symbology tab. In the Show box, click Quantities and select Graduated colors.For Fields > Value, pick the calculated density (i.e., nc2_seattle.dns_crswlk_mi2) field. Pick a Color Ramp that you like. Click OK.
Crosswalk density per NC seems to decrease with distance from the city center. Now repeat the process for sidewalks. and see what the sidewalk density would look like in Seattle. Save the map document. The deliverable: Reference: This tutorial was originally designed by Phil Hurvitz in 2007. The tutorial has been modified to better work with the new ArcGIS 10 work environment. prepared by Ming-Chun Lee, 04/24/2016
|