|
|
|
Analysis using Classification Algorithm
Classification is a process where a model is built describing a
predetermined set of data classes. The model is constructed by
analyzing all the records in the database. Each tuple is assumed
to belong to a predefined class, as determined by one of the
attributes called the class label. The tuples analyzed to build
the model form the training data set. Typically, the learned model
is expressed in terms of decision trees or classsification rules.
These rules can be used to predict the test data set.
We used See5 as the classification tool for our project. See5 is
the commercial version of the C4.5 decision tree algorithm developed
by Ross Quinlan. See5/C5.0 classifiers are expressed as decision
trees or sets of if-then rules. It is based on the ID3 decision
tree algorithm. A brief description of the algorithm is as follows:
-
The tree starts as a single node representing the training samples.
-
If the samples are all of the same class, then the node becomes a
leaf and is labeled with that class.
-
Otherwise, the algorithm uses an entropy-based measure known as
Information Gain as a heuristic for selecting the attribute that
will best separate the samples into individual classes. This
attribute becomes the "test" or "decision" attribute at the node.
-
A branch is created for each known value of the test attribute
and the samples are partitioned acccordingly.
-
The algorithm uses the same process recursively to form a
decision tree for the samples at each partition.
-
The recursive partition stops when all the samples for a
given node belong to the same class or if there are no
remaining attributes on which samples may be further
partitioned.
Data Preparation for See5
See5 applications require two files, the names file and the data file.
There are other optional files like test file. The names file (eg.
Card_Mining.names) describes the attributes and classes. The data
file (eg. Card_Mining.data) provides information on the training cases
from which See5 will extract patterns. The third kind of file used by
See5 consists of new test cases (eg. Card_Mining.test) on which the
classifier can be evaluated.
We used Weka to split the data into a (80/20) training and testing
data set. Weka has the filter (SplitDataSetFilter), which generates
subsets for a dataset. We split the data into 5 folds and and combined
4 folds to form the training set and the last one as the testing data
set. We have 3600 training instances and 900 testing instances.
See5 Decision Tree Results and Analysis
We ran See5 using the RuleSets option and the Boost option with 3
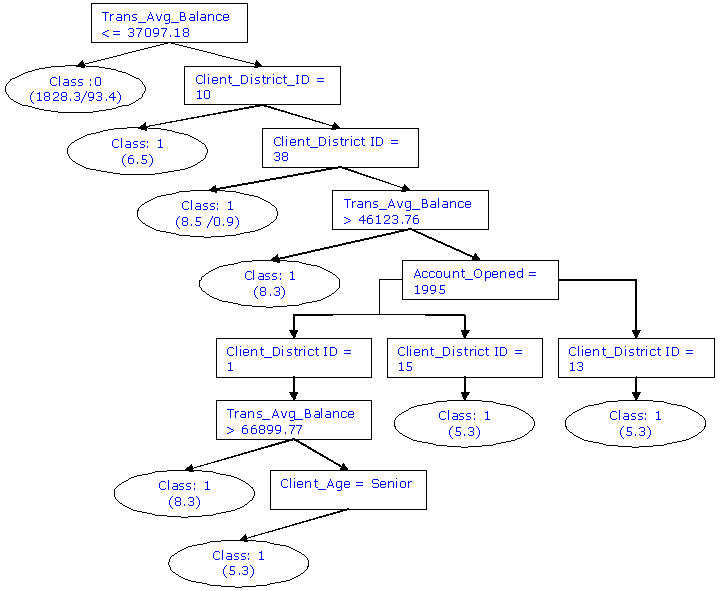
trials. The following is the simplified version of the decision tree
generated by See5. To build the following tree we used the Rules
obtained, which had high confidence (>85%).
 See5 looks at the root node to determine if all the cases in this node
belong to the same class. If they do not, it then grows branches from
this node using the variable that best sorts the customers into distinct
groups. Here all the customers having Transaction_Avg_Balance < 37907
are classified as class 0 ( Non Card Holder). About 1828 of the instances
were correctly classified as non-cardholders and 93 instances were
incorrectly classified. Following the split at the root node, the
resulting ndoes are examined. Further splits may take place (eg:
Account_Opened = 1995) or the tree may terminate at a node. For eg.
Client_District_Id terminates to a node with class 1 ( Card Holder).
A terminal node is called a "leaf node " or "class probability". When
used for predication this can provide and estimated probability if a new
customer is a card holder or not. This is achieved for a new customer by
checking the condition at the top of the tree and working down the branches
depending on its attribute values until it reaches a leaf node.
See5 also has the ability to express the clasifiers as Rule sets, which
are easier to understand. It generated 96 rules , out of which we have
listed 3 rules. All of these have confidence of more than 90%
Rule 1
Rule 1/1: (1828.4/93.4, lift 1.3)
Trans_Avg_Balance <= 37097.18 --> class 0 [Conf = 0.948]
If Trans_Avg_Balance <= 37097.18, Then Class Prediction is taken as Non-CardHolder
Rule 2
Rule 1/3: (8.3, lift 3.7)
Client_Age = M
Client_District_ID = 1
Trans_Avg_Balance > 66899.77 --> class 1 [Conf = 0.903]
If (Client_Age = Middle-Age) and (Client_District_ID = 1) and (Trans_Avg_Balance = 66899.77), Then Class Prediction is that of a Card Holder.
Rule 3
Rule 1/4: (8.3, lift 3.7)
Client_District_ID = 60
Trans_Avg_Balance > 46123.76
Loan_Status = none --> class 1 [Conf = 0.903]
If (Client_District_ID = 60) and (Trans_Avg_Balance > 46123.76) and (Loan_Status = none), Then Class Prediction is that of a Card Holder.
The entire See5 output (including all 96 rules) can be viewed here, in a text file.
Data Set Evaluation
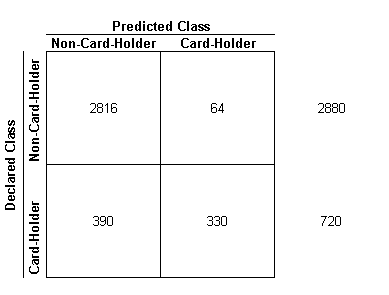
Training Set Evaluation (3600 Cases)
 The horizontal rows represent the cases that were declared and the
vertical rows represent the cases that were predicted by the algorithm.
- The estimated predictive error = (64 + 390)/3600 = 12.6%
- The percentage of instances that were correctly classified as Non-card holders = (2816/2880) = 97%
- The percentage of instances that were incorrectly classified as Non-card holders = (64/2880) = 22.2%
- The percentage of instances that were in-correctly classified as Card holders = (390/720) = 54%
- The percentage of instances that were correctly classified as Card holders = (330/720) = 45%
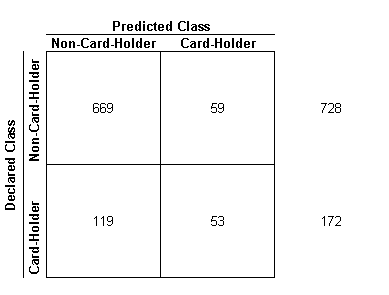
Test Set Evaluation (900 Cases)

- The estimated predictive error on the Test set is = ( 59 +119)/900 = 19.7%
- The percentage of instances that were correctly classified as Non-card holders = (669/728) =91%
- The percentage of instances that were incorrectly classified as Non-card holders = (59/728) = 8.1%
- The percentage of instances that were in-correctly classified as Card holders = (119/172) = 69%
- The percentage of instances that were correctly classified as Card holders = (53/172)= 73.6%
|
|
 See5 looks at the root node to determine if all the cases in this node
belong to the same class. If they do not, it then grows branches from
this node using the variable that best sorts the customers into distinct
groups. Here all the customers having Transaction_Avg_Balance < 37907
are classified as class 0 ( Non Card Holder). About 1828 of the instances
were correctly classified as non-cardholders and 93 instances were
incorrectly classified. Following the split at the root node, the
resulting ndoes are examined. Further splits may take place (eg:
Account_Opened = 1995) or the tree may terminate at a node. For eg.
Client_District_Id terminates to a node with class 1 ( Card Holder).
A terminal node is called a "leaf node " or "class probability". When
used for predication this can provide and estimated probability if a new
customer is a card holder or not. This is achieved for a new customer by
checking the condition at the top of the tree and working down the branches
depending on its attribute values until it reaches a leaf node.
See5 also has the ability to express the clasifiers as Rule sets, which
are easier to understand. It generated 96 rules , out of which we have
listed 3 rules. All of these have confidence of more than 90%
Rule 1
 The horizontal rows represent the cases that were declared and the
vertical rows represent the cases that were predicted by the algorithm.
